Two Minute Soundbite
Observations
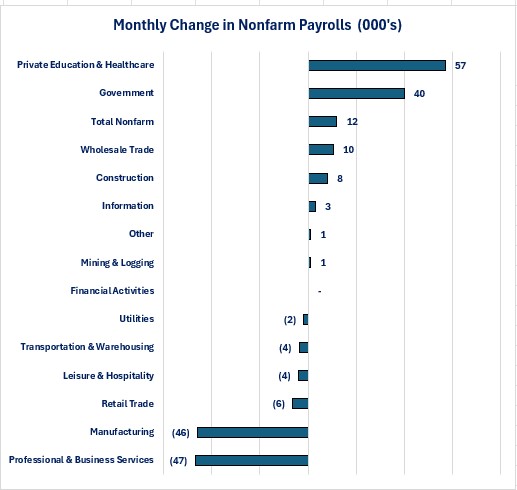
We have to view October's data with caution since two hurricanes occurred in close proximity to when the data was collected. Boeing was also a factor as the Transportation sub-industry within the Manufacturing industry lost 44,400 jobs.
Nonfarm Payrolls-Monthly Change in Number of Jobs-
Eight industries experienced positive jobs growth totaling 120,400 jobs.
-
Two industries accounted for 80.6% of the positive jobs growth total.
-
Government: 40,000
-
Private Education & Healthcare: 57,000
-
-
-
Six industries experienced negative jobs growth totaling 108,800.
-
Two industries accounted for 85.5% of the total job losses.
-
Professional & Business Services: -47,000
-
Manufacturing: -46,000. Declines in the transportation subsector accounted for 44,400 of those job losses. This would be Boeing and related suppliers to Boeing due to the ongoing strike.
-
-
Nonfarm Payrolls-Monthly Percentage Change
-
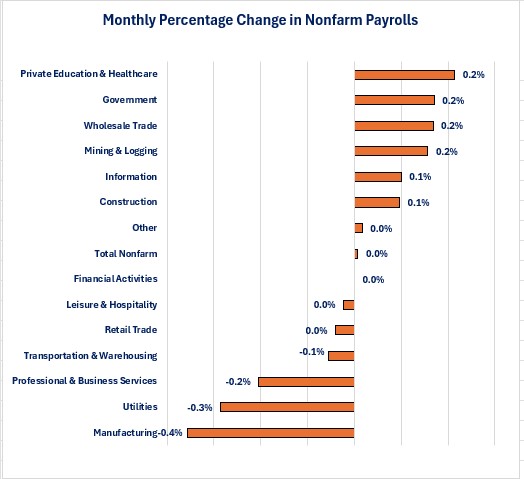
Four industries had the strongest monthly percentage change.
-
Private Education & Healthcare: +0.2%
-
Government: +0.2%
-
Wholesale Trade: +0.2%
-
Mining & Logging: +0.2%
-
-
Manufacturing experienced the biggest percentage decline at -0.4%.
Average Weekly Earnings-Percentage Change From a Year Ago
-
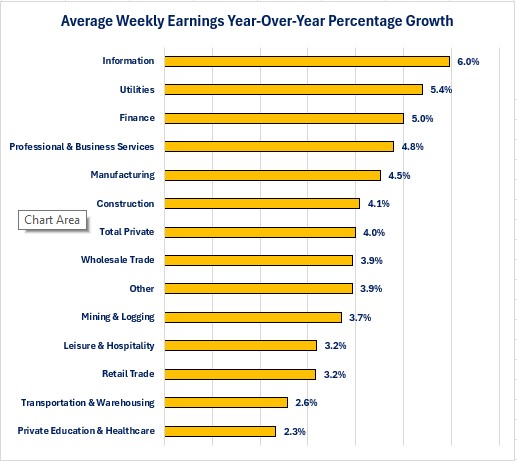
Seven industries experienced weekly wage growth over 4% on a year-over-year basis.
-
Only two industries had wage growth less than 3%.
Average Weekly Earnings-Dollar Change From a Year Ago
-
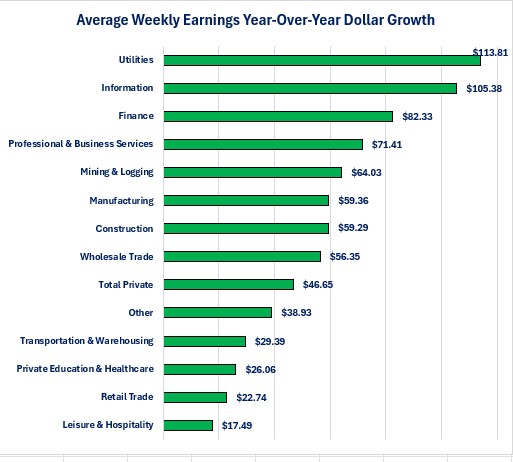
Utilities experienced the largest dollar growth in wages over the last year while Leisure & Hospitality experienced the smallest dollar increase.
-
The gap between the highest dollar gain and the lowest was $96.32 per month.
-
The average worker did not receive any extra income from working more hours as the average work week was unchanged at 34.3 hours.
Household Survey
-
The number of people reporting that they became employed fell 368,000.
-
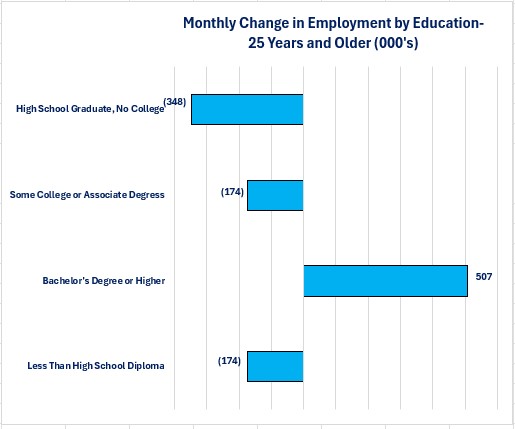
When examining the data by educational attainment, only those with a bachelor's degree of higher reported an increase in employment.
-
Unemployed
-
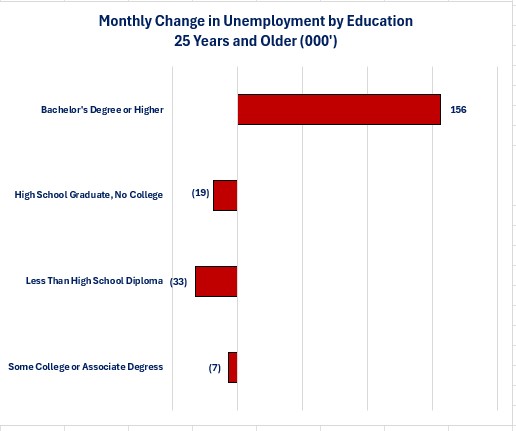
Those with a bachelor's degree or higher are also the only education group that reported an increase in the number of people reporting they became unemployed.
-
The fact that all other education categories reported decreases in the number of people employed and unemployed indicates that these education categories experienced people who gave up looking for work and dropped out of the labor force
Other Data
-
The unemployment rate remained unchanged at 4.1%,
-
The labor force participation rate fell from 62.7% to 62.6% as the labor force decreased by 220,000.
-
People working part-time due to slack work conditions rose by 24,000 while people working part-time because they could only find part-time work fell by 90,000.
-
The number of people working multiple jobs fell by 354,000.
-
The average duration of unemployment rose from 22.6 weeks to 22.9 weeks.
-
The percentage of people who have been unemployed for 27 weeks or more fell from 23.7% to 22.9%. This may be a sign that they gave up looking for work after their unemployment benefits ran out (26 weeks).
Conclusions
- October's employment report does not give us any clear information about the state of the US jobs market due to the distortions from weather and strikes.
-
There are competing factors that makes the chance for another reduction in interest rates from the Federal Reserve at its November meeting a toss-up.
-
On its own, the small gain in jobs in October would most likely not cause the Federal Reserve to lower its overnight borrowing rate at its November meeting since it is aware of the distortions.
-
The large downward revision to the past two months may cause concern from the Federal Reserve.
-
The 4% wage gain cannot give the Federal Reserve comfort as it relates to inflation.
-
-
For now, we will have to examine other October data sets to try to understand the state of the current state of the economy.

Steve is the Economist for Washington Trust Bank and holds a Chartered Financial Analyst® designation with over 40 years of economic and financial markets experience.
Throughout the Pacific Northwest, Steve is a well-known speaker on the economic conditions and the world financial markets. He also actively participates on committees within the bank to help design strategies and policies related to bank-owned investments.


