


Two Minute Soundbite
Summary
The nation continues to add jobs, but downward revisions show weaker jobs growth than originally reported. The BLS revised June's data lower by 61,000 and July's data by 25,000. This resulted in a net revision lower of 86,000 jobs.
-
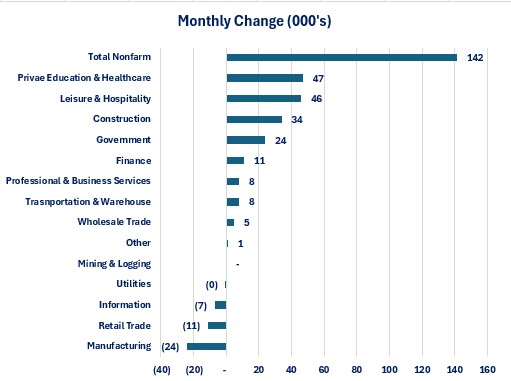
The nation added 142,000 jobs in August. That is 53,000 more than July.
-
Average hourly earnings rose 3.8%.
-
Average weekly earnings rose 3.5%.
-
The unemployment rate fell from 4.3% to 4.2%.
-
The top three industries accounted for 89.4% of total jobs growth.
-
The number of people working part-time for economic reasons rose by 339,000.
-
The number of people working multiple jobs rose by 65,000.
-
Today's jobs report supports the argument for the Federal Reserve lowering rates by 0.25% at its September meeting.
Observations
-
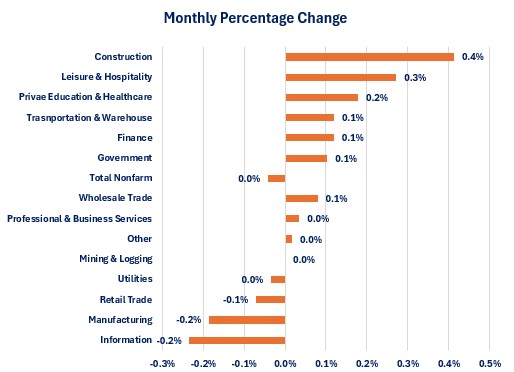
When measured on a percentage basis, the Construction industry experienced the fastest jobs growth for the month and the Information and Manufacturing industries tied for the weakest jobs growth.
- When measured by change in number of jobs, Private Education & Healthcare was the top industry for number of jobs created and Manufacturing was the lowest. Private Education & Healthcare, Leisure & Hospitality and Construction accounted for 89.4% of total jobs created
-
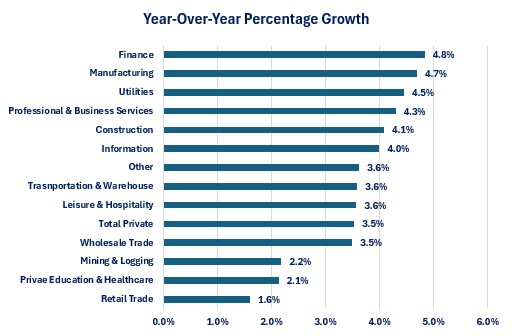
When measured on a year-over-year percentage basis, Finance experienced the fastest wage growth over the past year while Retail Trade experienced the lowest growth rate.
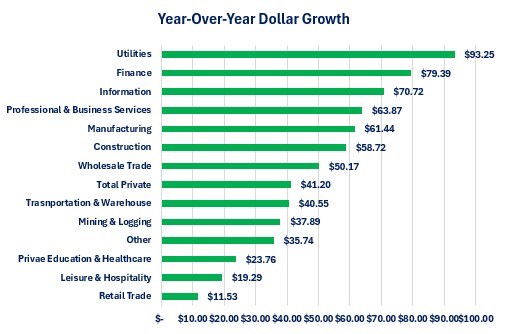
- When measured by actual dollar growth, the average worker in the Utilities industry experienced the largest increase in their paychecks while employees in the Retail Trade industry experienced the smallest increase. Unfortunately, the Utilities industry is the smallest industry in the US for jobs while Retail Trade sixth biggest.
Household Survey
The Household survey showed an increase of 168,000 employed people and a 68,000 decrease in unemployed people. The labor force grew by 120,000. The net result was a decline in the unemployment rate from 4.3% in July to 4.2% in August.
-
The number of people working part-time due to economic conditions rose by 339,000.
-
Those working part-time due to slack business conditions rose by 318,000.
-
-
The number of full-time workers fell by 438,000.
-
The number of people working multiple jobs rose by 65,000.
For those people who were already unemployed, their situation saw mixed results.
-
The average duration of unemployment rose from 20.6 weeks in July to 21.0 weeks in August.
-
The percentage of people who have been unemployed for 27 weeks or more fell from 21.6% in July and to 21.3% in August
Conclusions
- The employment data for August shows an economy that continues to produce jobs.
-
How many is becoming more uncertain given the fact that there has been a consistent pattern of revising the numbers lower in the following months.
-
-
Based on the guidance from Federal Reserve Chairman Powell in his last speech, August's jobs data virtually guarantees the Federal Reserve will lower its overnight borrowing rate at its September meeting. The question is how much.
-
In my opinion, the data justifies a 0.25% reduction not a 0.50% reduction as some are arguing.
-
The risk associated with a 0.50% reduction is that businesses and individuals may interpret that to mean the Federal Reserve is sending a message that it believes the economy is far weaker than the economic data shows. This could create a self-fulling prophecy if people start acting like the economy is in a recession versus the reality of what is actually occurring.
-
A 0.50% reduction could also trigger accusations of the Federal Reserve playing politics since the economic data still points to 3rd quarter GDP growth close to 2.0%.
-
-

Steve is the Economist for Washington Trust Bank and holds a Chartered Financial Analyst® designation with over 40 years of economic and financial markets experience.
Throughout the Pacific Northwest, Steve is a well-known speaker on the economic conditions and the world financial markets. He also actively participates on committees within the bank to help design strategies and policies related to bank-owned investments.