


Soundbite.
Despite all of the noise, worry, and uncertainty over fiscal policy, the nation continued to create jobs at a healthy pace.
-
228,000 jobs were created in March.
-
January and February data was revised down by a total of 48,000.
-
Average weekly earnings rose 3.2%
-
The unemployment rate rose from 4.1% to 4.2% as the labor force grew 232,00 while employment only grew 201,000.
Observations.
Payrolls
-
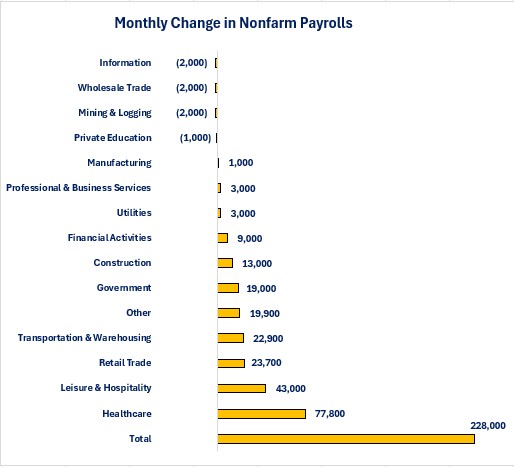
The top four industries for jobs growth accounted for 73.4% of total jobs growth.
-
The bottom two industries for wages (Leisure & Hospitality and Retail Trade) accounted for almost one-third of total jobs growth (29.3%)
-
Healthcare experienced the strongest jobs growth (77,800) and accounted for 34.1% of total jobs growth on its own.
- Four industries lost jobs
-
Information = -2,000
-
Wholesale Trade = -2,000
-
Mining & Logging = -2,000
-
Private Education = -1,000
-
-
Two of the highest paying industries (Information and Mining & Logging) lost jobs.
Wages
-
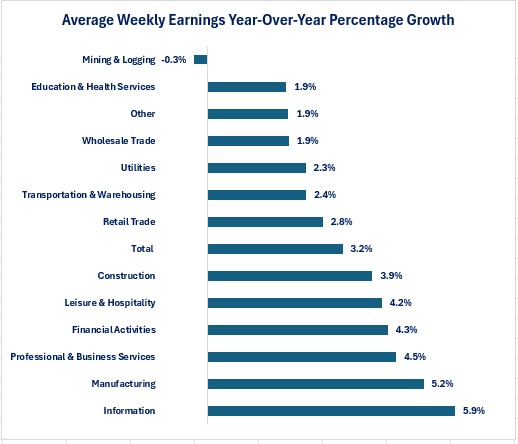
Average weekly earnings rose 3.2% year-over-year.
-
Five industries experienced year-over-year wage growth over 4%
-
Leisure & Hospitality = 4.2%
-
Financial Activities = 4.3%
-
Professional & Business Services = 4.5%
-
Manufacturing = 5.2%
-
Information = 5.9%
-
-
Four industries experienced wage growth below 2.0%
-
Mining & Logging = -0.3%
-
Education& Health Services = 1.9%
-
Other Services = 1.9%
-
Wholesale Trade = 1.9%
-
-
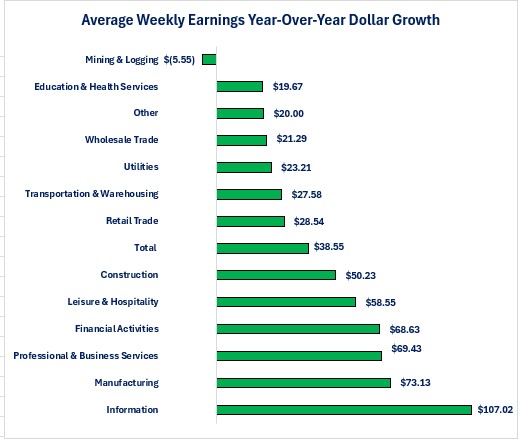
The gap between the highest year-over-year wage increase versus the lowest was $112.57 per week.
-
Information = $107.02 year-over-year weekly wage increase
-
Mining & Logging = -$5.55 year-over-year weekly wage decrease.
-
-
Hourly employees did not receive any additional income due to increased hours worked as the average workweek remained unchanged at 34.2 hours.
-
The unemployment rate rose from 4.1% to 4.2% as the labor force grew 232,000 while employment grew 201,000.
-
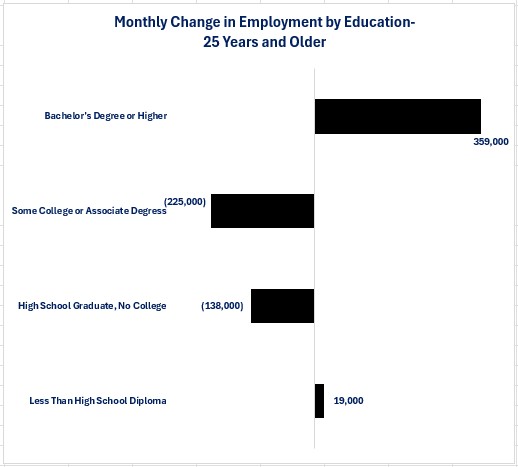
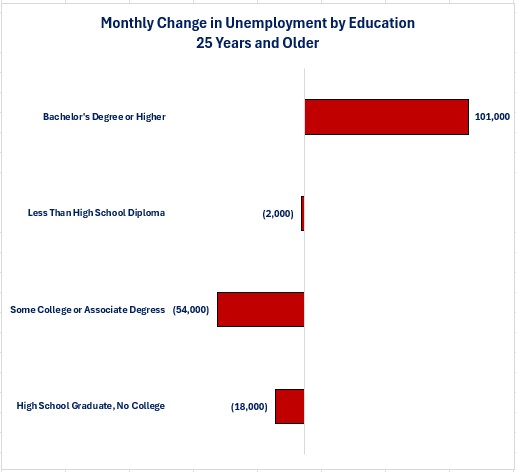
Virtually all of the increase in people reporting that they had become employed was in the Bachelor's Degree of Higher category.
-
The High School Graduate, No College and the Some College or Associate Degree categories experienced a decrease in employment.
-
-
Even though the Bachelor's Degree or Higher category had the strongest employment growth, it also had the highest unemployment growth.
-
All other educational categories experienced declines in unemployment.
-
Other data
-
The Labor Force Participation rate rose from 62.4% to 62.5%
-
The Underemployment rate fell from 8.0% to 7.9%
-
The number of people working multiple jobs rose from 8,860,000 to 8,896,000.
-
The number of people working multiple jobs as a percent of total employed rose from 5.4% to 5.5%.
-
Conclusions.
- The March nonfarm payroll data shows an economy that continues to create jobs at a steady pace.
-
That is important since jobs create income and income is the fuel that powers consumer spending.
-
Despite all of the noise, worry and uncertainty over President Trump's fiscal policies, the economy continued to produce jobs.
-
-
March's nonfarm payroll report will do nothing to convince the Federal Reserve to lower its overnight borrowing rate.
-
The impact of the new tariff tax going into effect on April 9th remain to be seen.
-
If the tariff tax causes the economy to slow, companies may start to consider layoffs.
-
We should see evidence of this first in the weekly jobless claims report and ultimately in the nonfarm payroll report.
-
-
March's nonfarm payroll report reinforces the message to ignore the noise of politics and focus on what is actually happening with your business and the economy.

Steve is the Economist for Washington Trust Bank and holds a Chartered Financial Analyst® designation with over 40 years of economic and financial markets experience.
Throughout the Pacific Northwest, Steve is a well-known speaker on the economic conditions and the world financial markets. He also actively participates on committees within the bank to help design strategies and policies related to bank-owned investments.