Perspectives.
With all of the speculation and noise swirling around what the new President, Administration and Congress may do, I thought it would be a good time to examine what businesses are currently experiencing.
Soundbite.
Based on the results of the Business Trends and Outlook Survey (BTOS) survey, economic conditions have not changed much from when the survey started. The overall results are another set of data that indicates the economy is ending the year on a solid footing. Although the largest percentage of responses is in the No Change category, there are areas that need to be monitored even though the current percentage of responses is small.
-
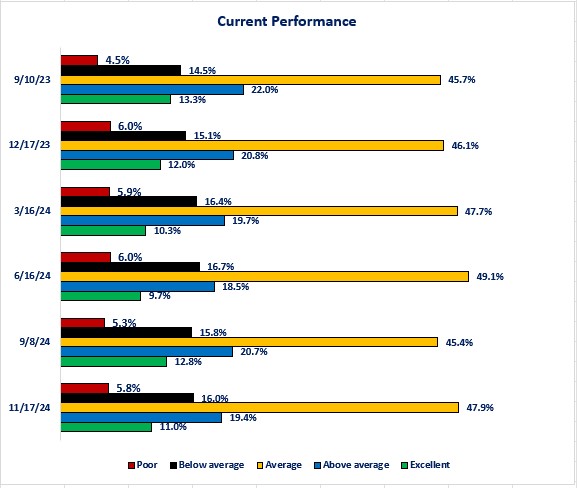
The percentage of business owners rating their overall performance as excellent has decreased while the percentage rating their overall performance as poor has risen slightly.
-
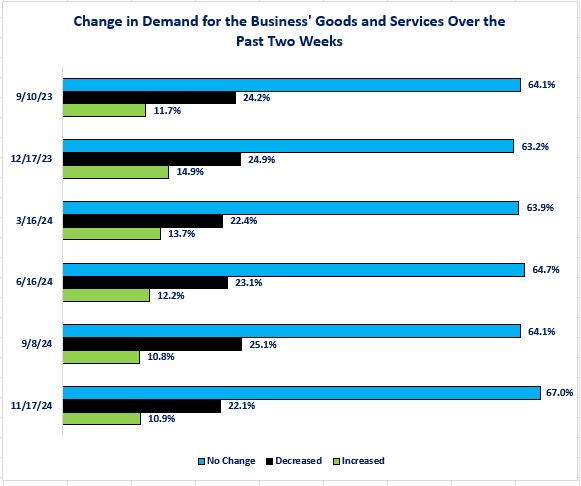
The percentage reporting increased demand for their goods and services has declined.
-
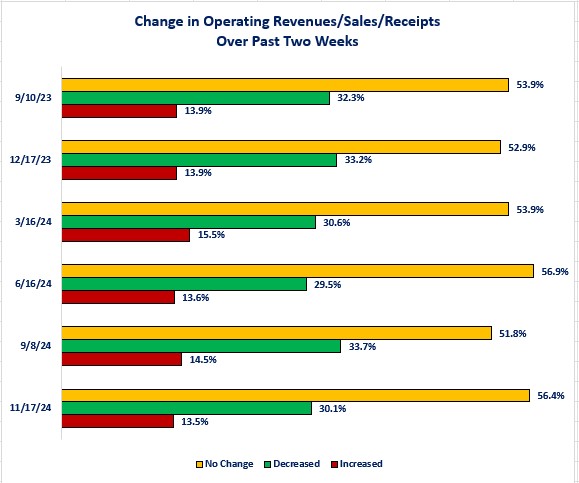
The percentage reporting an increase in revenues/sales/receipts has declined.
-
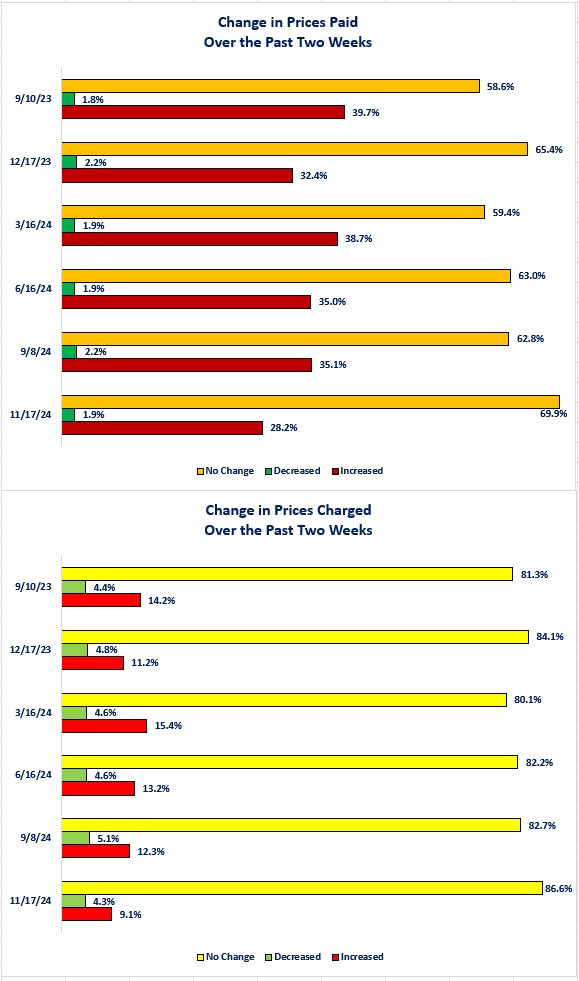
A larger percentage of businesses are reporting an increase in the prices that they must pay versus those reporting an increase in the prices that they can charge.
Disclosures.
The data comes from the Census Bureau.
-
Businesses surveyed include single and multiple location businesses but excludes farms.
-
This is a relatively new survey, so the data range is 9/10/23 through 11/17/24.
Given the relatively short history of the survey, I am going to examine data over three-month increments with survey dates that most closely match three months from the starting survey date.
This week I am focusing on what business owners are experiencing. Next week will focus on their outlook for the future.
Observations.
Let us start at the macro level and examine how business owners rate their company's current overall performance.
Current Performance-
The percentage of business owners rating their company's performance as excellent has fallen from 13.9% when the survey started to 11.0% now.
-
The percentage of business owners rating their company's performance as poor has risen from 4.5% as of 9/10/23 to 5.8% as of 11/17/24.
-
-
The majority of business owners continue to rate their company's performance as average.
Now, let us drill down and examine components that lead to the overall performance assessment. Let us begin by examining changes in the demand for a business' goods and services.
Change in Demand For Goods and Services Over the Past Two Weeks-
The percentage of business owners reporting an increase in demand has fallen from the peak level (12/17/23) of 14.9% to 10.9%. It has also fallen from the 11.7% level when the survey started.
-
The percentage reporting a decrease in demand is down from the peak level of 25.1% as of 9/8/24 to 22.1%. While that is good news, it is still the reality that the percentage of business owners reporting a decrease in demand is more than double the percentage reporting an increase.
-
Next, let us examine what has happened with revenues/sales/receipts.
Change in Operating Revenues/Sales/Receipts Over Past Two Weeks-
The percentage of owners reporting an increase in revenues/sales/receipts has fallen a full percentage point from 9/8/24 to 11/1/24. It is also down from 13.9% when the survey started.
-
The good news is that the percentage of owners reporting a decrease fell from 33.7% as of 9/8/24 to 30.1% as of 11/17/24. It is also down from 32.3% when the survey started.
-
-
The bottom line is that the largest percentage of business owners reported no change in the demand for their goods and services and that translated into the largest percentage of business owners reporting no change to their revenues/sales/receipts.
Now, let us examine delivery times to gain perspective on any supply chain issues.
Change in Time to Receive Deliveries Over the Past Two Weeks-
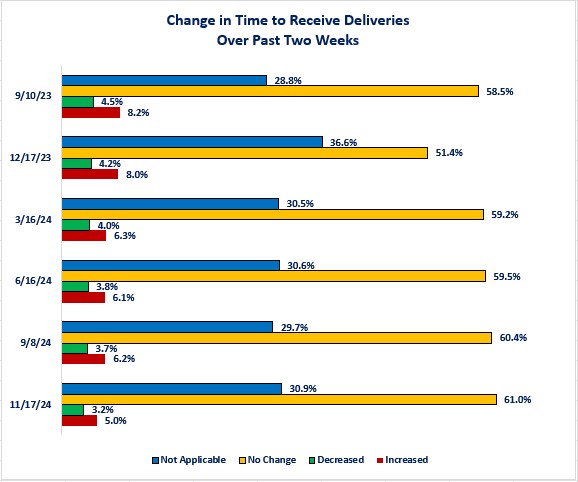
The good news is that over 60% of business owners reported no change in the time to receive deliveries.
-
Of course, that does not tell us whether the “no change” delivery time is the time desired by the business.
-
Next, let us examine price behavior for potential clues for inflation. As we have seen since the end of the pandemic crisis, businesses have attempted to pass on any price increases that they experience from their suppliers.
Change in Prices Paid and Prices Charged Over the Past Two Weeks-
-
The bad news is that there are still over 28% of business owners reporting an increase in the prices that they are charged by their suppliers while only 9% reported increasing the price they charge for their goods and services.
-
Once again, the data does not provide insight as to whether the decision not to increase prices was voluntary (i.e., strategic decision to maintain market share) or involuntary (i.e., forced to in order to match their competition).
-
Finally, let us examine what the impact of the interest rate environment has been on businesses.
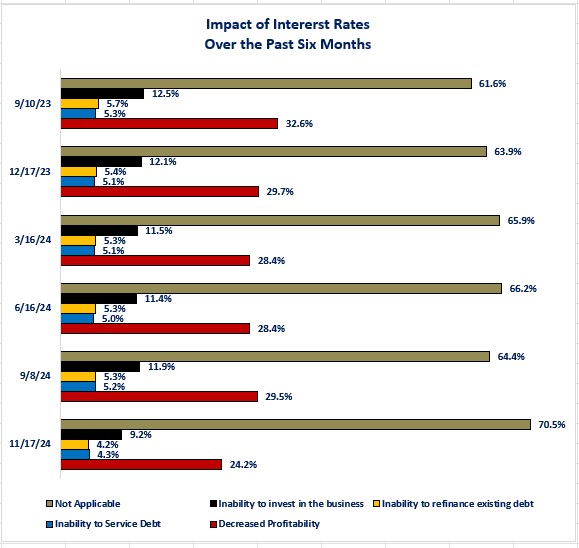
Impact of Interest Rates Over the Past Six Months-
Over 70% of business owners reported that interest rates have had no impact on their businesses.
-
Almost 25% of respondents reported decreased profitability due to interest rates. The good news is that is down from the peak percentage of 32.6% as of 9/10/23.
Closing thoughts.
- Based on the BTOS results, business owners are communicating that it is “business as usual”.
-
They do not seem exuberant (i.e., rate performance as excellent) but they are also not glum (i.e., rate their performance as Poor).
-
In this case, average is not necessarily a terrible thing.
-
-
It is worth monitoring the fact that the percentage of business owners reporting a decrease in demand for their goods and services is double the percentage reporting an increase. Given the relatively short time frame of this survey being in existence we cannot really draw any conclusions about whether this ratio has existed for a while or whether it is new within the past 15 months.
-
The encouraging sign is that the percentage reporting a decrease in demand has fallen more than the percentage decline in those reporting an increase. That has resulted in a larger percentage reporting no change.
-
-
The same story exists for revenues/sales/receipts.
-
There has been a bigger percentage point decrease in those reporting a decline in revenue/sales/receipts compared to the decline in those reporting an increase. Once again, this resulted in an increase in the percentage reporting no change.
-
-
It is nice to see that delivery time is not an issue for the vast majority of survey respondents.
-
Another area worth monitoring for bigger changes is the higher percentage of business owners reporting they are being charged higher prices by their suppliers versus the percentage of business owners reporting they are increasing prices for their goods and services.
-
The implication of this is that if business owners cannot offset the increased cost from their suppliers, then profit margins narrow. That is not a sustainable business model over the longer term.
-
-
It is encouraging to see the high percentage of business reporting no impact from the current interest rate environment.
-
That may either be due to them not incurring debt or because they locked in interest rates before rates went up. This indicates that businesses have lower sensitivity to Federal Reserve interest rate policy than what might have existed in the 1980 and 1990s.
-
When you add in the fact that so many homeowners are locked in with low interest rates for their mortgage, you begin to gain perspective on why the increase in interest rates did not slow the economy as much as many econometric models predicted.
-
We do need to pay attention to the fact that the biggest category impacted by the current interest rate environment was the Decreased Profitability category.
-
It could be a lethal combination for any business that is suffering decreased profitability due to interest rates and is also suffering decreased profitability because they are one of the businesses that cannot fully pass through price increases from their suppliers.
-
-
-
Given the overall “business as usual” results from the survey, this indicates that the economy remains on solid footing heading toward year-end.
-
Since the economy has been growing consistently over 2% (on a year-over-year basis) for the past nine quarters, “business as usual” should not be a headwind for continued growth.
-
We will need to monitor the results of this survey as new policies and laws come out of the new Administration and Congress next year to see if the survey provides any type of signals that give us additional insight into the future course of the economy.
-
Economic data.
|
Economic Data |
Time Period Reported |
Current Results |
Previous Results |
Comments |
|
12/9/24 |
|
|
|
|
|
Wholesale Sales Monthly Change |
October |
-0.1% |
+0.5% |
Sales dropped slightly in October. |
|
Wholesale Inventories Monthly Change |
October |
+0.2% |
-0.2% |
Inventories grew as sales slowed. |
|
12/10/24 |
|
|
|
|
|
NFIB Small Business Optimism Index |
November |
101.7 |
93.7 |
Small business owners’ confidence surged after the election. This is the first time in 35 months that it has been above its 50-year average. |
|
Nonfarm Productivity Quarterly Change |
3rd Quarter |
+2.2% |
+2.5% |
Productivity grew at a slightly slower pace than the second quarter. |
|
Unit Labor Costs Quarterly Change |
3rd Quarter |
+0.8% |
+0.4% |
Labor costs rose at twice the pace of the second quarter. |
|
12/11/24 |
|
|
|
|
|
MBA Mortgage Applications Weekly Change |
12/6/24 |
+5.4% |
+2.8% |
This is the fifth consecutive month of increases. |
|
12/6/24 |
-1.1% |
+5.6% |
Buyers apparently decided to go holiday shopping instead house shopping. |
|
12/6/24 |
+27.2% |
-0.06% |
Refinance activity surged even though mortgage rates were basically unchanged. |
|
Consumer Price Index (CPI) Monthly Change |
November |
+0.3% |
+0.2% |
Year-to-date inflation is now at 3%. It should be at 1.8% year-to-date to hit the Federal Reserve's 2% goal. |
|
November |
+0.3% |
+0.3% |
This is the fourth consecutive month of 0.3% increases. |
|
CPI Year-Over-Year Change |
November |
+2.7% |
+2.6% |
Moving in the wrong direction. |
|
November |
+3.3% |
+3.3% |
No progress in moving toward 2%. |
|
12/12/24 |
|
|
|
|
|
Initial Jobless Claims |
12/7/24 |
242,000 |
225,000 |
While initial claims rose this week, they remain within the range of 200,000 to 250,000. |
|
Continuing Jobless Claims |
11/30/24 |
1,886,000 |
1,871,000 |
Continuing claims rose 15,000. |
|
Producer Price Index (PPI) Monthly Change |
November |
0.4% |
+0.2% |
Food prices drove the bigger-than-expected increase as they rose 3.1%. |
|
November |
0.2% |
+0.3% |
Core CPI rose more modestly. |
|
PPI Year-Over-Year Change |
November |
3.0% |
2.6% |
Inflation for raw materials rose faster than expected. |
|
November |
3.5% |
+3.1% |
On a year-over-year basis, Core CPI rose stronger than expected. |
|
12/13/24 |
|
|
|
|
|
Export Price Index Year-Over-Year Change |
November |
+.8% |
-0.1% |
Export prices rebounded from the decline experienced in October. |
|
Import Price Index Year-Over-Year Change |
November |
+1.3% |
+0.8% |
Business and individuals who buy imported goods and services continue to see price increases. |

Steve is the Economist for Washington Trust Bank and holds a Chartered Financial Analyst® designation with over 40 years of economic and financial markets experience.
Throughout the Pacific Northwest, Steve is a well-known speaker on the economic conditions and the world financial markets. He also actively participates on committees within the bank to help design strategies and policies related to bank-owned investments.


