Last week's Perspectives section examined potential exposure to the US and its states if new or higher tariffs are imposed on products imported into the US. A country that has tariffs imposed on the products it exports to the US (imports for the US) may retaliate by imposing tariffs on products imported by their businesses from the US (exports for the US). Today's Perspectives section examines the exposure for the US and its states to the other side of tariffs: exports.
Soundbite
If countries have new or higher tariffs assessed against the products they export to the US (US imports), they may institute retaliatory tariffs on products the US exports to their country. This could hurt the sales of US exporters. Lower exports mean lower US GDP growth.
-
Canada and Mexico account for 33% of total exports.
-
The top three US export products make up 40.9% of total exports.
-
Texas is the leading state for exports as exports from Texas account for 22.1% of total US exports.
Remember that the threat of tariffs is not the same as the actual implementation of tariffs. US exporters should develop a game plan for the risk of tariffs being imposed so that they are able to respond objectively if threats become reality.
Disclosures
The data comes from the US International Trade Agency and is as of 9/30/24.
-
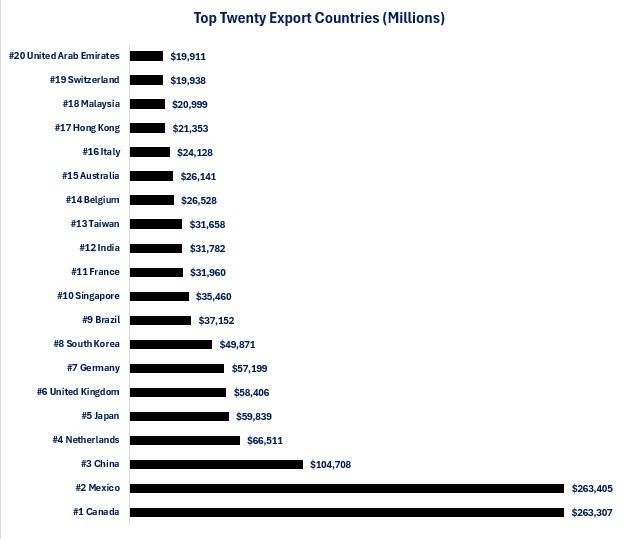
Top twenty countries for US exports.
-
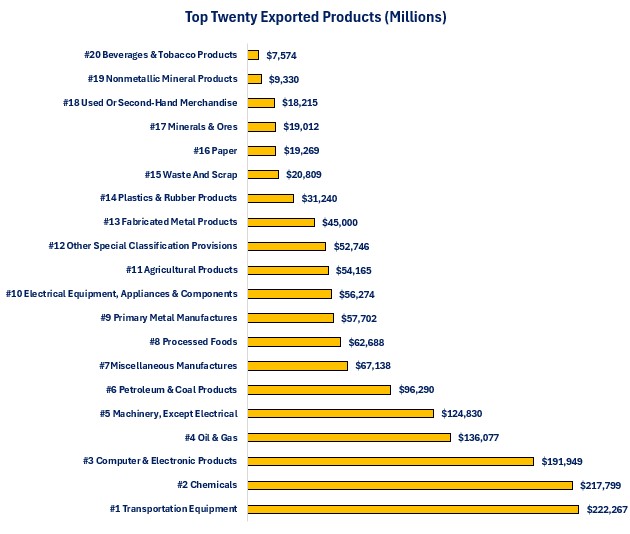
Top ten products exported by the US.
-
Top five products exported to the top twenty US export countries.
-
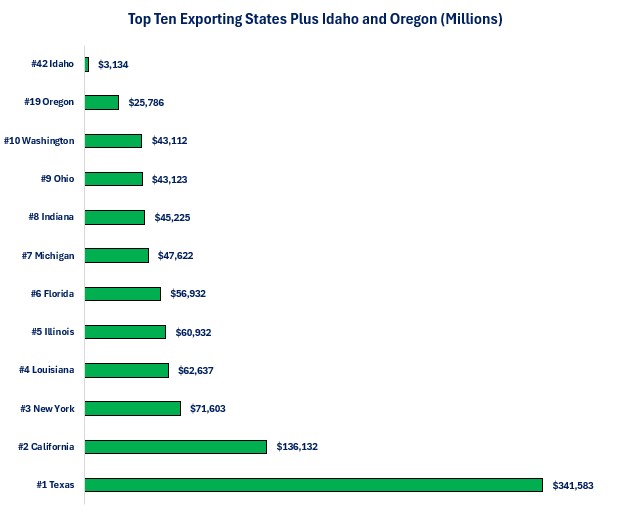
Top ten states, plus Oregon and Idaho, for US exports.
-
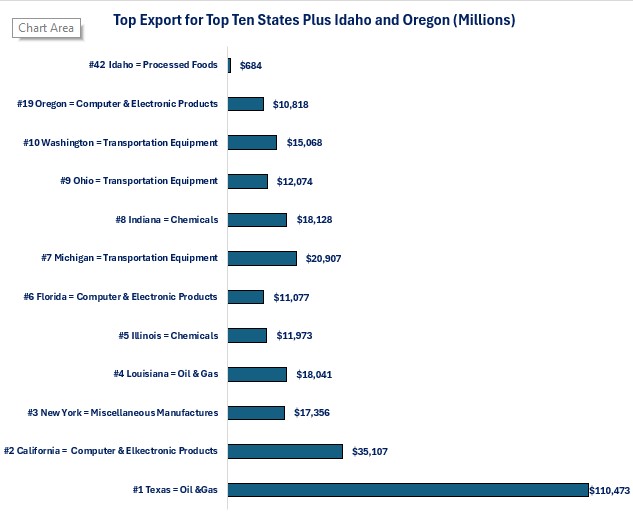
Number one exported product by the top ten, plus Oregon and Idaho, export states.
Observations
Let us start by examining who are the major trading countries for US exports. Since exports are a revenue source for US businesses and add to US GDP growth, I am going to examine the top twenty versus the top ten that were examined for imports.
Top Twenty Countries for US Exports-
Export trade with Canada and Mexico accounts for 33% of total exports.
-
This highlights the two-way flow of trade (imports and exports) that exist because of the free trade agreement between the three countries.
-
Now, let us examine the major products that are exported by the US.
Top Ten Products Exported by the US-
The top three export products make up 40.9% of total exports.
-
Transportation Equipment = 14.4%
-
Chemicals = 14.1%
-
Computer & Electronic Parts = 12.4%
-
-
The top three export products make up 2.2% of total US GDP.
To help understand potential exposure to retaliatory tariffs on US exports, the following table shows the top five export products for the top twenty countries where the US conducts export business.
Top Five Export Products to the Top Twenty Countries for US Exports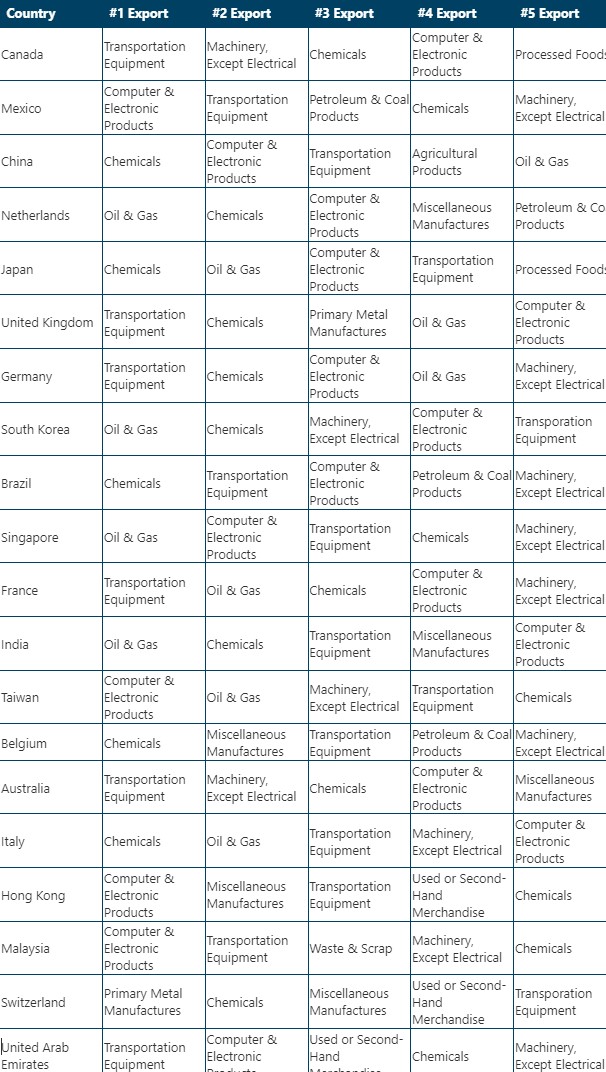
If retaliatory tariffs are going to occur, which states have the biggest exposure to exports?
Top Ten Exporting States in the US plus Oregon and Idaho-
Texas dominates when it comes to exports.
-
Texas exports make up 22.1% of total US exports.
-
-
Louisiana's economy has the biggest exposure to exports.
-
Exports make up 19.2% of Louisiana's GDP.
-
Exports make up 12.7% of the GDP for Texas.
-
-
For the three states where Washington Trust Bank has offices, Oregon's economy has the biggest exposure to exports.
-
Exports make up 7.8% of total Oregon GDP.
-
Exports make up 5.1% of Washington's GDP.
-
Idaho has the smallest exposure as exports make up 2.5% of Idaho's GDP.
-
If businesses in the export states being examined are going to potentially lose business if retaliatory tariffs are imposed, it is important to understand what type of product is at risk. The next graph examines the top export product for the top ten states (plus Oregon and Idaho).
Top Export for the Top Ten Exporting States Plus Oregon and Idaho-
Michigan has the biggest concentration risk for exports.
-
Transportation Equipment makes up 43.9% of Michigan's total exports.
-
Illinois has the smallest concentration as Chemicals only make up 19.6% of total exports.
-
-
For the three states where Washington Trust Bank has offices, Oregon has the highest concentration exposure.
-
Computer & Electronics exports make up 42.0% of Oregon's total exports
-
Transportation Equipment exports make up 35.0% of Washington's total exports.
-
Processed Foods make up 21.8% of Idaho's total exports.
-
Commentary
- The threat of US tariffs has been the hot topic of conversation since the elections.
- Just this week, President-elect Trump announced his intention to impose 25% tariffs on all Canadian and Mexican imports and an additional 10% tariff on Chinese imports.
-
What has not received nearly as much press or discussion is the threat to US exporters if countries that have new or higher US tariffs imposed on them choose to retaliate with tariffs on US products being imported into their country.
-
Remember that export sales add to US GDP growth.
-
Any loss in export sales due to countries shifting their purchases away from US products will hurt GDP growth.
-
The threat for a US exporter is if their foreign customer can find a new supplier that does not impose tariffs. A loss of business is effectively a 100% tax.
-
The risk for US exporters is that other countries strategically target tariffs on US products that have competing choices.
-
That would allow their businesses to shift their supply chain away from the US.
-
-
Canada, Mexico and China are the major US trading countries for US exporters.
-
They account for 33% of total US exports.
-
-
The US has concentration risk for its exports as the top three export products comprise 40.9% of total US exports.
-
Transportation Equipment
-
Chemicals
-
Computer & Electronics
-
-
A trade war (i.e. dueling tariffs) creates the threat of slowing global economic growth.
-
Tariffs are a tax on any business (globally) that buys imported products that have tariffs assessed against them. The difference with a tariff tax compared to other taxes (like an income tax) is that businesses can directly tie the tariff to a product when identifying and increasing the price of a product.
-
If businesses cannot find a new supplier and decide to pass the cost of the tariff onto the price of their end product, then inflation will remain a global problem.
-
-
The reality that we must keep in perspective is that the threat of tariffs by any country is far different than actual tariffs imposed.
-
All countries can use the threat of tariffs as a negotiating tool for other topics that they want addressed.
-
President-elect Trump's stated reason for planning new tariffs on Canada and Mexico is because he does not believe they have done enough to curb illegal immigration into the US. His stated reason for higher tariffs on China is because he believes they have not done enough to stop the flow of Fentanyl into the US.
-
-
Remember that tariffs are not a simple thing to implement or avoid so the process will not happen immediately.
-
It takes time to put the processes in place to identify items that will be tariffed, and to calculate and collect the tariffs.
-
It is also not a simple process to avoid tariffs. Changing supply chains takes time assuming that a buyer can even identify a new supplier.
-
-
-
Tariffs on US exports have the same level of uncertainty as US plans to impose tariffs on imports.
-
Now is the time to develop a game plan if your business has exposure to potential tariffs.
-
This will allow you to respond objectively once the details on actual tariffs imposed become known.
-
Economic Data
|
Data |
Time Period Being Reported |
Current Results |
Previous Results |
Comments |
|
11/25/24 |
|
|
|
|
|
Chicago Federal Reserve National Activity Index |
October |
-0.40 |
-0.27 |
Economic activity slowed further based on this index. |
|
Dallas Federal Reserve Manufacturing Activity Index |
October |
-2.7 |
-3.0 |
Manufacturing activity in the Dallas Federal Reserve Region contracted further in October. |
|
11/26/24 |
|
|
|
|
|
FHFA House Price Index Year-Over-Year Change |
September |
+4.4% |
+4.4% |
The growth in prices matched the pace experienced in August |
|
S&P/Core Logic House Price Index Year-Over-Year Change |
September |
+3.9% |
+5.2% |
This is the slowest pace of growth since August 2023. |
|
Consumer Confidence Index |
November |
111.7 |
109.6 |
Confidence increased as survey participants cited increased confidence in the jobs markets as a major reason for increased confidence. |
|
New Home Sales Monthly Change |
October |
-17.3% |
+4.1% |
The decline was primarily driven by the plunge in sales in the South due to the hurricanes. |
|
Richmond Federal Reserve Manufacturing Activity Index |
November |
-14 |
-14 |
Manufacturing activity continued to contract in the Richmond Federal Reserve region with no change from October's level. |
|
Richmond Federal Reserve Service Sector Activity Index |
November |
+9 |
+3 |
Even though activity contracted in manufacturing, service sector activity improved in the Richmond Federal Reserve region. |
|
11/27/24 |
|
|
|
|
|
MBA Mortgage Applications Weekly Change |
11/22/24 |
+6.3% |
+1.7% |
Applications rose for the third week in a row. |
|
11/22/24 |
+12.24% |
+2.0% |
Buyers were back in the market last week. |
|
11/22/24 |
-2.6% |
+1.8% |
Refinancing applications continued to fall as mortgage rates remain elevated. |
|
Initial Jobless Claims |
11/23/24 |
213,000 |
215,000 |
Claims rose by 2,000 but continue to remain at low levels. |
|
Continuing Jobless Claims |
11/16/24 |
1,907,000 |
1,898,000 |
All of the increase resulted from a downward revision of the previous week's data. |
|
Gross Domestic Product (GDP) Quarterly Annualized Growth |
3rd Quarter |
+2.8% |
+3.0% |
No changes were made to the original estimate of 2.8%. |
|
PCE Price Index Year-Over-Year Change |
October |
+2.3% |
+2.1% |
The headline index moved in the wrong direction compared to what the Federal Reserve desires. |
|
Core PCE Price Index Year-Over-Year Change |
October |
+2.8% |
+2.7% |
Lack of progress in the Core PCE Price Index may well slow the pace of interest rate cuts from the Federal Reserve. |
|
Personal Income Year-Over-Year Change |
October |
+5.0% |
+5.5% |
Growth in personal income slowed but remained solid. |
|
Real Disposable Personal Income Year-Over-Year Change |
October |
2.7% |
3.1% |
Growth in Income after taxes and inflation also slowed slightly. |
|
Durable Goods Orders Monthly Change |
October |
+0.2% |
-0.4% |
Orders rebounded in October after declining in September. |
|
Core Durable Goods Orders Monthly Change |
October |
+0.1% |
+0.4% |
Growth in orders excluding transportation and defense order slowed in October. |
|
Trade Balance |
October |
-99.1 Billion |
-108.7 Billion |
Imports fell $15.2 billion while exports only fell $5.6 billion. |
|
Chicago PMI |
November |
40.2 |
41.6 |
Manufacturing activity fell further in the Chicago Federal Reserve district. |
|
11/28/24 |
|
|
|
|
|
Thanksgiving No Economic Data |
|
|
|
|
|
11/29/24 |
|
|
|
|
|
No Economic Data |
|
|
|
|

Steve is the Economist for Washington Trust Bank and holds a Chartered Financial Analyst® designation with over 40 years of economic and financial markets experience.
Throughout the Pacific Northwest, Steve is a well-known speaker on the economic conditions and the world financial markets. He also actively participates on committees within the bank to help design strategies and policies related to bank-owned investments.


