Based on consumer surveys, inflation and prices remain key areas of concern and stress for the average household. Many post-election surveys show that inflation and high prices were a factor in many voters' decision-making process for the recently concluded US elections. Since the Bureau of Labor Statistics released data for one of the inflation indices on Wednesday, I thought this would be a good time to revisit the story on inflation and prices.
Soundbite
Disclosures
-
The data comes from the Bureau of Labor Statistics (BLS) for the Consumer Price Index (CPI) and the Bureau of Economic Analysis (BEA) for the Personal Consumption Expenditures Price Index (PCEPI).
-
The Federal Reserve focuses on the “core” part of each index as a tool for helping determine its monetary policy.
-
Core excludes food and energy prices.
-
-
The Core CPI data is as of 10/31/24.
-
The Core PCEPI data is as of 9/30/24.
-
I am using the 10/31/24 Core CPI data when examining the components of inflation since it is the most current. CPI and PCEPI both measure the same major items that are being examined in today's newsletter. The difference is how each index weights the components to arrive at the total inflation rate.
Observations
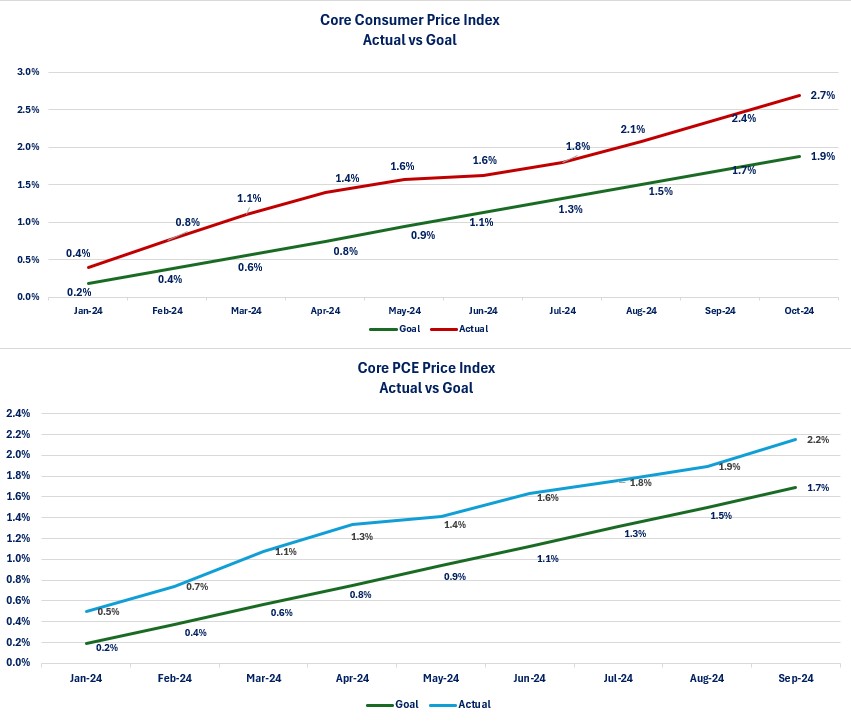
Let us start by examining progress towards the Federal Reserve's goal of 2% for the two core inflation indices. This approach looks at inflation similar to how a business owner monitors their budget. If a business owner has a goal of keeping expense growth at 2% or better for 2024, they would then monitor a report that shows actual year-to-date expense growth compared to the year-to-date goal
Inflation-Progress to Goal-
Both inflation measures are already above the Federal Reserve's 2.0% target.
-
The Federal Reserve continues to communicate its confidence that inflation will decrease back to its target.
-
Clearly, neither of the two official core inflation rates will meet the target goal in 2024 unless we have some big price decreases over the next two months. Currently there are no forecasts for prices to decrease.
-
As you can see from the graph below, the current trend is not declining for either index.
-
The financial markets are viewing the recent inflation reports as good news simply because they matched what was forecast. It is doubtful the average household or business owner shares that view.
-
The next question that may arise is “what is driving inflation?”. Let us examine the major components of inflation for goods and services.
Inflation-Goods vs Services-
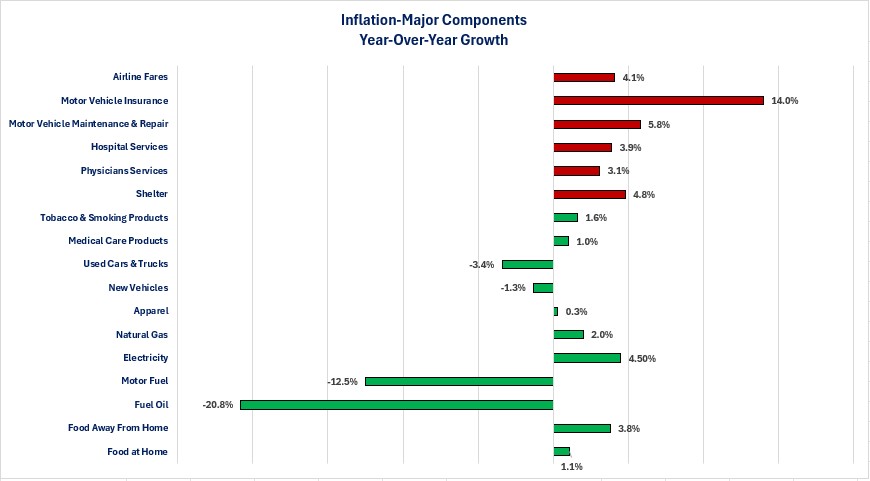
When examining what is driving inflation, we can examine the major categories that the BLS publishes for Goods and Services inflation. Goods inflation components are the green bars while the Services components are the red bars.
-
As the chart illustrates, all of the major Services components are experiencing year-over-year inflation rates above the 2% goal while all but two of the Goods components are below the 2% goal. The problem is that the Services components comprise a bigger share of the inflation calculation versus Goods.
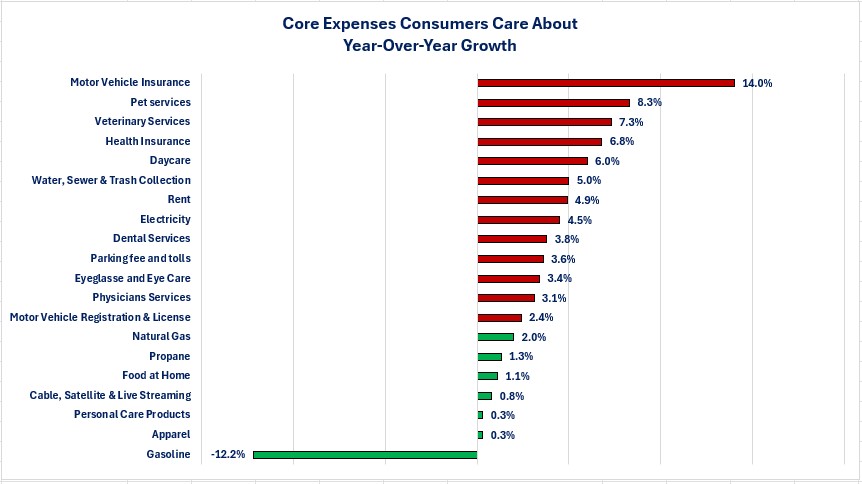
Examining the major components of inflation gives us a better understanding of what is driving the official inflation rate but, it does not necessarily give us a clearer picture of the average household's inflation rate. The next graph examines subcomponents that, in general are components that the average household cares about since they are most likely buying these goods and services.
Inflation-What an Average Family Probably Cares About-
All components that have red bars have year-over-year inflation rates that are above the 2% goal while those with green bars have rates below the goal.
-
As the chart illustrates, there are far more components with year-over-year inflation rates above 2% than those below. This helps explain why consumer surveys show a consumer that is unhappy even though the economy and wages are still growing.
he above graphs provide information and perspective on the growth rates for various components of goods and services that average household purchases. What it does not provide is information and perspective on what these growth rates translate into for prices.
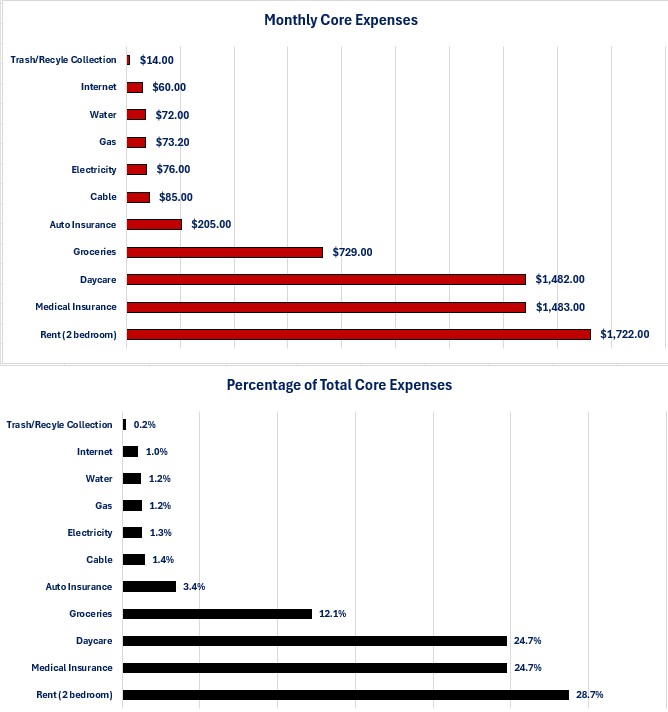
In the next section I will try to illustrate how inflation has translated into prices and the impact that the resulting prices are having on the average household. I am focusing on the “core” expenses most households may incur and will attempt illustrate how much of the average household income is consumed by these core expenses. Conceptually, core expenses are the expenses that are the “must pay” expenses. What is left over after the core expenses are what the average household has left for discretionary spending, debt repayment or savings. In no way is this a claim that it reflects the overall cost of living for the average household or for your family. It is strictly an attempt to give a macro view of what inflation has done for the average household's core expenses and, perhaps explain why consumer sentiment surveys still show an unhappy consumer. Clearly, your core expenses may be different.
-
Average family: One adult male (16-50 years old), one adult female (16-50 years old), one child (1-15 years old).
-
Income: Per capita personal income (as reported by the BEA)
-
Core expenses:
-
Rent: 2-bedroom apartment (average of data provided by Rent Cafe and Apartments.com)
-
Utilities (water, trash/recycling, electricity, internet, and cable as provided by Clean Energy.com)
-
Daycare (average of studies done by the firms Illumine and Self)
-
Groceries (USDA)
-
Gasoline (Gas Buddy)
-
Auto Insurance (Bankrate)
-
Medical Insurance (Healthcare.gov)
-
- Shelter (rent), medical insurance and daycare are the three largest core expenses.
-
Those three items consume 38.1% of the income of a two-income family and 76.2% of the income of a one-income family.
-
For a one-income household that does not have their child in daycare, total core expenses consume 48.8% of their income. If they have their child in daycare then core expenses consume 97.6% of their income.
-
For a two-income family that does not have their child in daycare, total core expenses consume 36.7% of their income. If they have their child in daycare then core expenses consume 73.5% of their income.
Closing Thoughts
- When examining the core inflation rate that the Federal Reserve monitors, we discover that the rate is above the goal desired by the Federal Reserve.
-
- This matters for businesses and individuals that have debt with a variable loan rate tied to short-term benchmarks (i.e. credit cards, operating lines, and lines of credit).
- Although the Federal Reserve has begun lowering its short-term interest rates, the pace of further decreases may be slower than borrowers are desiring unless inflation progresses toward the 2% goal.
- The financial markets may be happy that the recent inflation data came in as expected, the average household may have a far different view.
- This matters for businesses and individuals that have debt with a variable loan rate tied to short-term benchmarks (i.e. credit cards, operating lines, and lines of credit).
-
There is no true universal inflation rate in the US.
-
Nobody purchases all of the items used to calculate the official inflation rates and they do not consume those goods and services in the same percentage weighting as what is used in the official calculation.
-
As a result, the average household is experiencing a different inflation rate than the official rate. Based on the data shown, they are experiencing a higher inflation rate.
-
Inflation rates also vary for different businesses depending on the goods and services they buy.
-
-
While it is important to understand the official inflation rates, since the Federal Reserve uses them as one of its tools for determining monetary policy, the reality is that the average household is more likely to care about price levels rather than growth rates.
-
The data shows that the current level of prices for the average household's core expenses is consuming a large amount of their income.
-
Many post-elections polls show that inflation and high prices were a factor for many voters in the recently concluded US elections.
-
Whether the policies being proposed by the new administration will create the change desired as it relates to prices remains to be seen.
-
-
It is too early to know whether the Republican party will resolve their internal disputes and unite to enact the policies that incoming President Trump wants.
-
There are components of his proposed policies that risk creating higher prices (i.e., tariffs, reduced labor supply via restrictions on immigration) but, there are components that could prevent price increases (increased productivity via reductions in costs associated with regulations and regulatory compliance, increased investment in productivity via tax cuts and incentives).
-
Until we see what gets implemented, it is too early to know what the impact on prices will be.
-
-
-
Historically, price decreases happen when one of two events happen:
-
Supply increases, demand falls or both, which results in causing a business' sales to decline. Prices are then lowered to increase sales. Sustained price decreases (versus sales events) are typically, associated with a recession.
-
New competition arrives that offers lower prices and existing businesses lower prices to maintain market share.
-
-
It should not be surprising that consumer sentiment surveys continue to show consumer sentiment that remains at historically depressed levels. The surveys show recent improvement in sentiment, but the level still is historically low.
-
An unhappy consumer does not mean that they stop spending, especially as it relates to their core expenses. This helps explain how you can have economic data that shows a steadily growing economy but a consumer that is unhappy.
-
- Once again, I will remind everyone that there is no “average” household and that the average prices that I used in analyzing core expenses for the analysis may not match prices that you are experiencing.
-
Different households have income levels that are different than the average and are experiencing different expense levels than the average.
-
Even with those differences, the analysis should still give you a perspective on why many households are unhappy with their current situation even though they have a job, and the economy is still growing.
-
-
The Federal Reserve, many economists, and financial market participants may be satisfied that the lower growth in inflation is making good progress towards the Federal Reserve's goal. The data and consumer surveys indicate that the average household does not agree.
-
Economic Data
|
Data |
Time Period |
Current Results |
Previous Results |
Comments |
|
11/12/24 |
|
|
|
|
|
NFIB Small Business Optimism Index |
October |
93.7 |
91.5 |
A surge in expectations for the economy and sales to improve drove the increase. |
|
11/13/24 |
|
|
|
|
|
MBA Mortgage Applications Weekly Change |
11/8/24 |
+0.5% |
-10.8% |
Applications crept back into positive territory led by an increase in applications to purchase a house. |
|
11/8/24 |
+1.9% |
-5.1% |
Buyers ventured back into the markets and pushed application volume into positive territory. |
|
11/8/24 |
-1.5% |
-18.5% |
A continued rise in mortgage rates continues to depress refinancing activity. |
|
Consumer Price Index (CPI) Year-Over-Year Change |
October |
+2.6% |
2.4% |
A 4.5% increase in Service inflation led the uptick in the inflation rate. |
|
Core CPI Year-Over-Year Change |
October |
+3.3% |
+3.3% |
The core inflation rate remained unchanged. |
|
11/14/24 |
|
|
|
|
|
Producer Price Index (PPI) Year-Over-Year Change |
October |
+2.4% |
1.9% |
Service inflation rose 3.5% while Goods inflation rose 0.2%. |
|
Initial Jobless Claims Weekly Change |
11/9/24 |
217,000 |
221,000 |
Initial claims decreased by 4,000. This is the lowest level since May. |
|
Continuing Jobless Claims Weekly Change |
11/2/24 |
1,873,000 |
1,884,000 |
Continuing claims decreased by 13,000. |
|
11/15/24 |
|
|
|
|
|
Retail Sales Year-Over-Year Change |
October |
+2.8% |
+2.1% |
Auto sales drove the increase as auto sales were up 3.4% and accounted for 19% of total retail sales. |
|
Export Prices Year-Over-Year Change |
October |
-0.1% |
-1.9% |
Prices received by US exporters were close to unchanged as prices fell 0.1%. |
|
Import Prices Year-Over-Year Change |
October |
+0.8% |
-0.1% |
US companies that buy imported products saw the decline in September reversed. |
|
New York Federal Reserve Manufacturing Index |
October |
31.2 |
-11.9 |
Manufacturing activity in the New York region staged a massive comeback from the declines in September. |
|
Industrial Production Monthly Change |
October |
-0.3% |
-0.7% |
Industrial production continues to decline but at a slower pace. Weather and strikes were a factor in the decline. |
|
October |
-0.5% |
-0.3% |
Manufacturing also continued to decline. The Boeing strike impacted manufacturing production. |

Steve is the Economist for Washington Trust Bank and holds a Chartered Financial Analyst® designation with over 40 years of economic and financial markets experience.
Throughout the Pacific Northwest, Steve is a well-known speaker on the economic conditions and the world financial markets. He also actively participates on committees within the bank to help design strategies and policies related to bank-owned investments.


