Finding enough qualified help remains an issue for many businesses. A lack of qualified help remains the No. 2 issue for small businesses based on the results of the NFIB Small Business Optimism survey. I have written about women in the labor before previously and this week's Perspectives section revisits the topic to examine whether women may be a potential source to increase the labor force.
Soundbite
Disclosures
The data is from the Bureau of Labor Statistics (BLS). Since October's jobs data were skewed by weather (hurricanes) and a strike (Boeing), I am going to examine the data up to September 2024.
Three time periods will be examined
-
20 years (9/30/04-9/30/24)
-
10 years (9/30/14-9/30/24)
-
Last three years (9/30/21-9/30/24)
Four areas will be examined:
-
Labor Force Participation Rate-Men versus Women
-
Percentage of total jobs in the US (men and women) held by women for each industry.
-
Industry share of total jobs held by women.
-
Change in total number of .jobs held by women
Observations
Let us start by examining the Labor Force Participation Rate (LFPR) for women compared to men.
Labor Force Participation Rate Men vs Women-
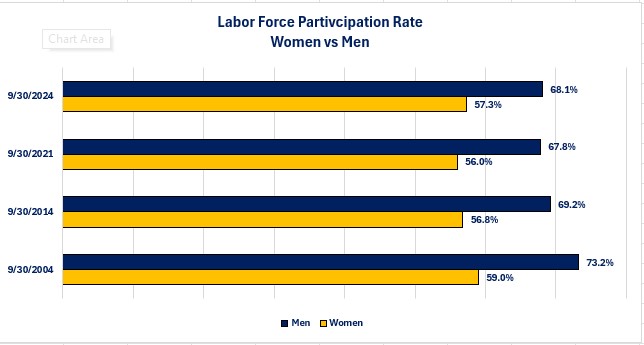
As of 9/30/24 the LFPR for women was 57.6%. The highest LFPR for women over the past 20 years was 59.6% (July 2006 and October 2008) and the low was 54.6% which occurred during the pandemic crisis (April 2020).
-
As of 9/30/24 the LFPR for men was 68.1%. The highest rate was 73.8% and occurred in January 2007. The low was 66.0% and occurred during the pandemic crisis (May 2020).
-
The LFPR for women has risen above the level that existed ten years ago while the men's LFPR remains below the level of ten years ago. Women have almost returned to the level that existed before the pandemic crisis (58.0%). Men are still below the level (69.3%) by over a full percentage point.
-
If the women's LFPR rose to the same 68.1% level as the men, there would be 14,939,000 additional people in the labor force.

Now let us examine, for all jobs in the US, what percentage are held by women for each industry.
Percentage of Total Jobs in an Industry Held by Women-
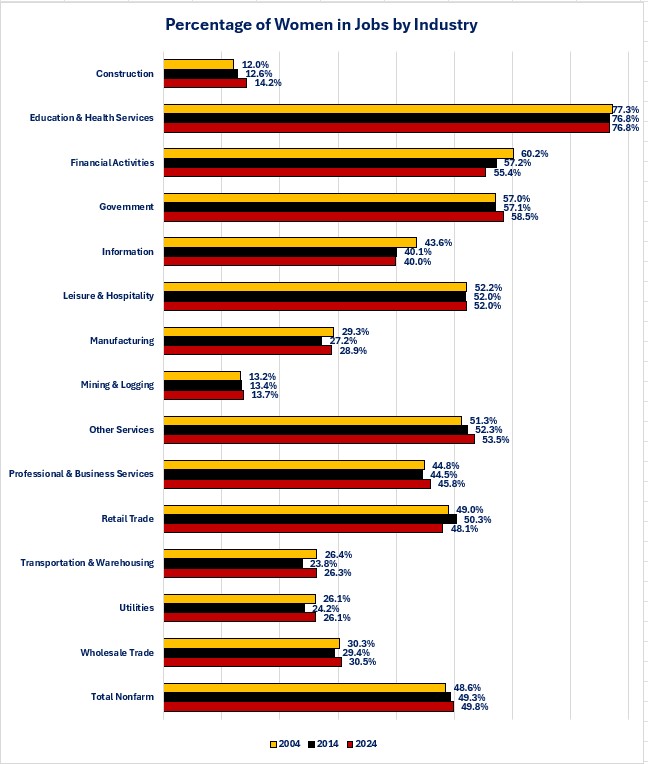
Women make up 51% of the civilian non-institutionalized, 16 years and older population.
-
Women occupy 49.9% of the total jobs in the US. This is an increase from the 48.6% level twenty years ago and the 49.3% level ten years ago. It is below the 50.1% level that existed shortly before the pandemic crisis.
-
Women occupy at least 50% of the jobs in five of the fourteen industry sectors used by the BLS. There are five industries where women occupy less than 30% of the total jobs in the industry.
-
-
Over the past twenty years, six industries experienced an increase in the percentage of women occupying jobs in the industry while nine industries experienced an increase over the past ten years.
-
Only the Construction and Other Services industries experienced an increase of more than one percentage point over the past twenty years while seven industries experienced an increase of more than one percentage point over the past ten years.
-
-
Five industries experienced a decrease in the percentage of women occupying jobs compared to twenty years ago and three industries experienced a decrease compared to ten years ago.

A second way to gain perspective on the role of women in the jobs market is to examine the total jobs held by women and see what percentage each industry comprises of the total. This allows us to see changes in the percentages specific to women.
Percentage of Total Jobs Held by Women for Each Industry-
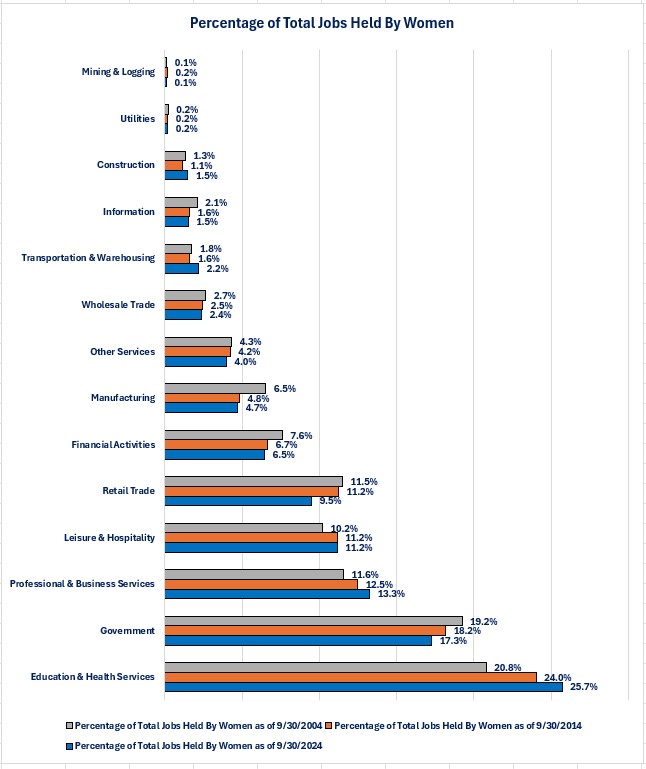
The chart below illustrates a similar picture as the previous chart. Women are concentrated in a few industries while having little participation in other industries.
-
Education & Health Services saw the biggest percentage point increase and remains the leading industry for the share of jobs held by women as a percentage of total jobs held by women.
-
Five industries experienced an increase of their share of total jobs held by women.
-
Only four industries experienced an increase in their share of total jobs held by women.
-

Examining the changes to the percentage of jobs held by women give us one perspective on women in the workforce. Another perspective is to understand the change in the number of jobs rather than the percentage of jobs.
Change in the Number of Jobs Held by Women in Each Industry-
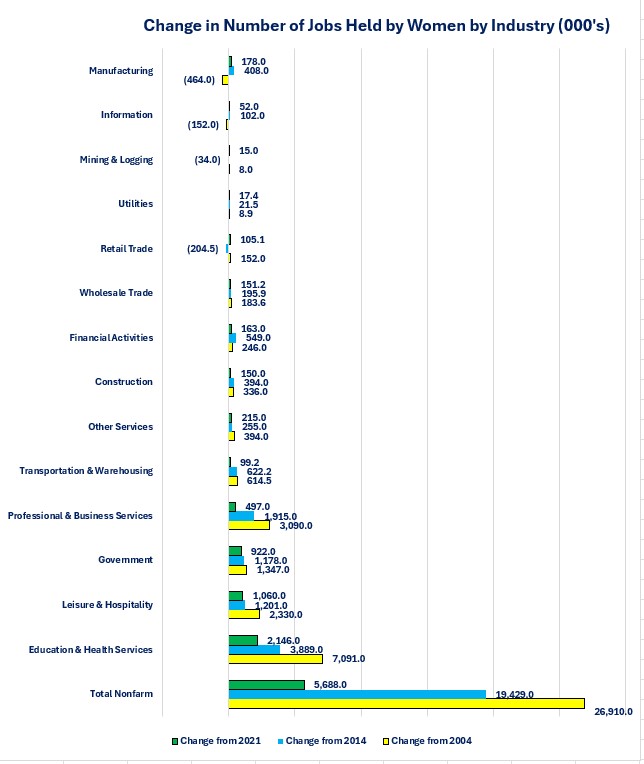
Over the past twenty years, jobs held by women increased 15,109,000. Education & Health Services added 7,091,000 jobs held by women and accounted for 46.8% percent of total growth in jobs occupied by women.
-
That dominance has decreased over the past three years as the Leisure & Hospitality, Government and Professional & Business Services industries captured larger shares of total jobs growth for women.
-
The biggest percentage point decline was in the Professional & Business Services sector, which dropped from 20.4% over the past twenty years to 8.7% over the past three years.
-
The biggest gain over the past twenty years was in the Government sector, which rose from 8.9% to 16.2%.
-
-
The Manufacturing and Information industries saw a decline in jobs held by women over the past twenty years but have experienced positive gains over the past ten and three years.
-
The Information, Manufacturing, Mining & Logging and Utilities industries each accounted for less than 1% of the growth in jobs held by women.
-

Closing Thoughts
-
Although women currently make up 49.9% of total jobs, they are filling more jobs over the past three years compared to men. Over the past three years, women have filled 52.4% of the jobs created.
- This is why the LFPR for women is close to returning to pre-pandemic levels while men still lag by over one percentage point compared to their pre-pandemic levels.
-
Even though October's data is skewed and was not incorporated in this analysis, an interesting data point from the October data is that there were 36,000 jobs created and filled by women, but 24,000 jobs lost that had been filled by men.
-
Finding enough qualified help continues to be a challenge for many industries and especially for small businesses. As highlighted at the beginning of this newsletter, a lack of qualified help is the No. 2 concern for small businesses based on the monthly Small Business Optimism survey conducted by the NFIB.
-
The challenge of finding enough qualified help will most likely remain if the dynamics of the labor force remain as they are. A few, but clearly not all, of the dynamics that will challenge the labor force include:
-
The aging of the Baby Boomer generation and ongoing retirements will drain labor that needs to be replaced.
-
Any actions to limit the immigration of legal, qualified help will negatively impact the labor force.
-
The rise in opioid usage and drug addiction has eliminated a portion of the population from the labor force.
-
-
Based purely on the numbers, women would appear to be a potential source of additional labor. As discussed at the beginning of this article, if women participated in the labor force at the same percentage as men, you would increase the labor force by over 14,000,000.
-
Clearly, accomplishing that is not as simple as the numbers show. There are multiple reasons why women may not be able to join the labor force with the cost of childcare being at or near the top of the list of reasons.
-
-
One of the goals of today's article is to put a spotlight on the fact that women are concentrated in a few industries while other industries employ a small percentage of women.
-
I recognize that some of this is long embedded societal “norms” as to what is viewed as a woman's versus a man's job.
-
In many cases, historically, some jobs did not fit for women due to physical demands. With the advances in technology and robotics, that excuse is highly questionable now.
-
-
For industries and companies that have less than 50% of their workforce being women, perhaps they should strategize on how to educate career counselors, parents and women about the benefits of working for them to help fill their labor needs.
-
This has already started for some industries and companies, so I am not suggesting a radical new idea.
-
If businesses can successfully increase the number of women in the labor force (i.e. increase the LFPR for women), then they are not stealing from one industry to staff another industry.
-
Economic Data
|
Data |
Time Period Being Reported |
Current |
Previous Result |
Comments |
|
11/4/24 |
|
|
|
|
|
Factory Orders Monthly Change |
September |
-0.5% |
-0.8% |
The pace of contraction slowed. October will most likely be highly skewed by the Boeing strike. |
|
11/5/24 |
|
|
|
|
|
S&P Global Services PMI |
October |
55.0 |
55.2 |
Activity was basically unchanged from September. |
|
ISM Non-Manufacturing Activities Index |
October |
57.2 |
59.9 |
Activity contracted even more based on the ISM index. |
|
11/6/24 |
|
|
|
|
|
MBA Mortgage Applications Weekly Change |
11/1/24 |
-10.8% |
-0.1% |
This is the 6th consecutive week of declines. |
|
11/1/24 |
-5.1% |
+5.0% |
A continued rise in mortgage rates reversed the increase in applications from the previous week. |
|
11/1/24 |
-18.5% |
-6.3% |
Rising mortgage rates continue to hurt refinancing activity. |
|
11/7/24 |
|
|
|
|
|
Nonfarm Productivity |
3rd Quarter |
+2.2% |
+2.5% |
Output increased 3.5% while hours work only increased 1.3%. |
|
Unit Labor Costs |
3rd Quarter |
+1.9% |
+0.4% |
A 4.1% increase in hourly compensation offset the 2.2% rise in productivity. |
|
Initial Jobless Claims |
11/2/24 |
221,000 |
218,000 |
Initial claims continued to hover in a range between 200,000 to 250,000. |
|
Continuing Jobless Claims |
10/26/24 |
1,892,000 |
1,853,000 |
Continuing claims rose 39,000 as those people who do become unemployed are finding it harder to find new employment. |
|
Wholesale Sales Monthly Change |
September |
+0.3% |
+0.2% |
Sales picked up slightly in September. |
|
Wholesale Inventories Monthly Change |
September |
-0.2% |
-0.1% |
Wholesalers continue to reduce their inventory levels. |
|
11/8/24 |
|
|
|
|
|
University of Michigan Consumer Sentiment Index |
November |
73.0 |
70.5 |
All of the improvement in sentiment occurred in consumers' outlook for the future. |
|
November |
64.4 |
64.9 |
Consumers are less confident about their current situation. |
|
November |
78.5 |
74.1 |
Consumers became far more confident about the outlook for the future. |

Steve is the Economist for Washington Trust Bank and holds a Chartered Financial Analyst® designation with over 40 years of economic and financial markets experience.
Throughout the Pacific Northwest, Steve is a well-known speaker on the economic conditions and the world financial markets. He also actively participates on committees within the bank to help design strategies and policies related to bank-owned investments.


