A pain point for many businesses is the challenge of finding qualified help to fill open positions. One way to view potential sources of labor supply is to examine the Labor Force Participation Rate. This measures the percentage of the population that is participating in the labor force. Today's Perspectives section examines the labor force participation rate.
Soundbite
- Women have returned to the labor force faster than men,
- The Asian population has returned to the labor force the fastest among all races.
- The youngest age category (16-19 years old) has returned to the labor force the fastest among all age categories.
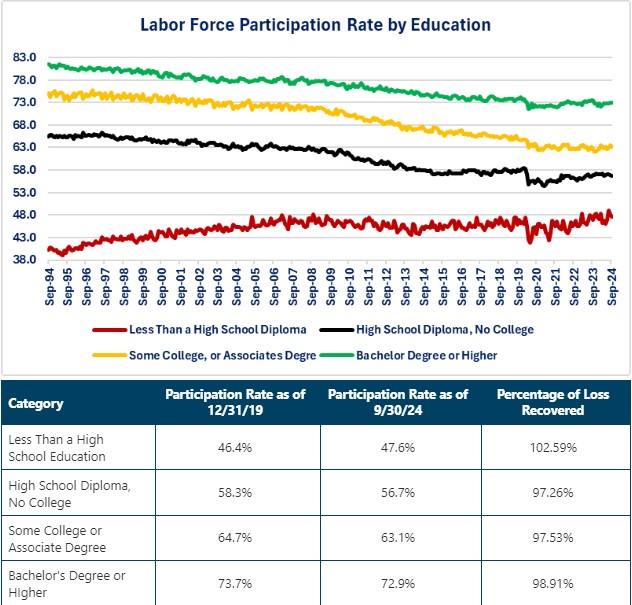
- People without a high school diploma have returned faster than all other education levels.
Observations
Let us start with two definitions to make sure we are all on the same page as to what the labor force participation rate is measuring.
-
Labor Force as defined by the Bureau of Labor Statistics (BLS): the number of people currently employed or actively looking for work (i.e., unemployed). That means that those who are out of work but not actively looking for work are not included.
-
Population as defined by the Census Bureau: The civilian noninstitutional population is people 16 years of age and older residing in the 50 states and the District of Columbia, who are not currently in institutions (e.g., penal and mental facilities, homes for the aged), and who are not on active duty in the Armed Forces.
Why do we care about the Labor Force Participation Rate? It helps us understand whether there is a pool of people that could potentially be available to join the labor force and help address labor shortages. The lower the ratio, the more people that may potentially be available to join the labor force. The reverse is true for a higher ratio. There are multiple reasons why a person may not be in the labor force but understanding the size of that pool may at least help businesses understand the potential and then try to identify if there are ways to bring those people into the labor force. As we consider the data, it would be normal to think that the youngest and oldest age groups should have a lower participation rate.
-
The population in the 16-24 year age range should be lower since this is the age that most of the youth of America are in school.
-
The population of people 55 and over should also be lower because a growing portion of the age group is retiring and no longer interested in working.
The Census Bureau (population) and BLS (labor force) break the data into the different categories. In order to give us multiple perspectives on the topic, I will utilize the following categories:
-
Men vs Women
-
Race
-
Age
-
Education
-
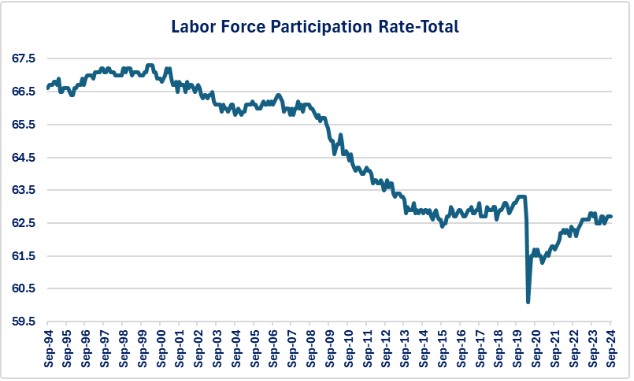
The graph illustrates that the labor force participation rate was declining from 1998 through 2014. At that point it showed a slow rise until the pandemic crisis hit. The rate has been improving since the lows of the pandemic crisis but has not returned to levels that existed before the crisis.
-
Rate as of 12/31/19 = 63.3% Current level: 62.7% Percent of loss recovered: 99.1%
-
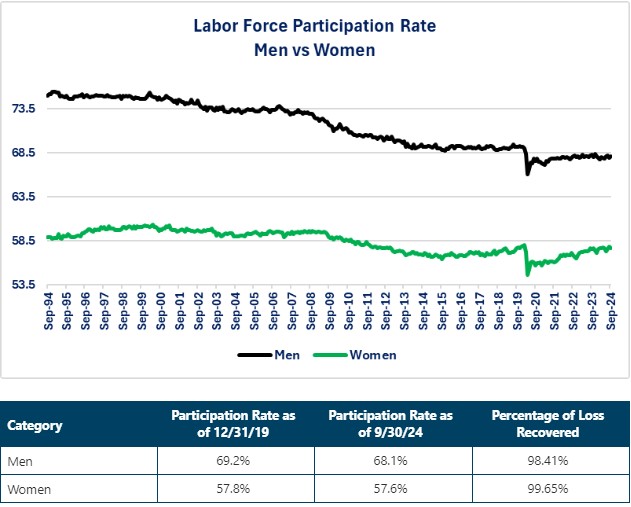
Men still have a higher participation rate than women but the trend since the end of the pandemic crisis shows the participation rate for women rising more than men. The table below the graph shows the current rates vs 12/31/19 and the percentage of the pandemic crisis loss that has been recovered,
-
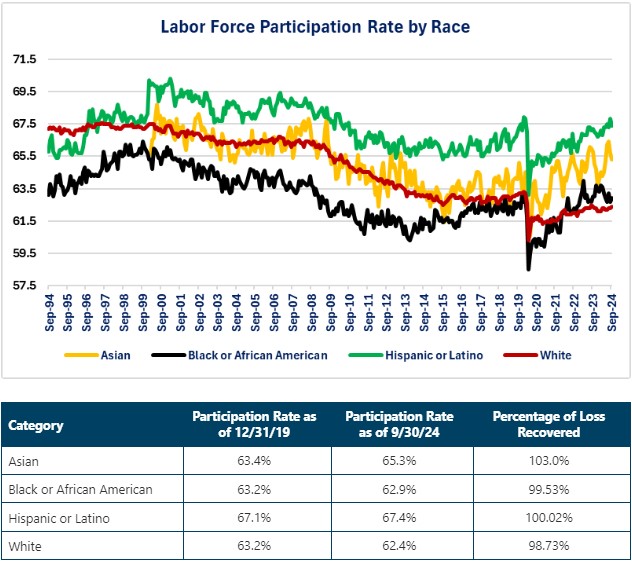
The Asian and Hispanic or Latino categories have fully recovered the decline of the participation rate due to the pandemic crisis while the Black or African American and While categories have not fully recovered.
-
The Hispanic or Latino category has consistently shown the strongest participation rate over the past thirty years.
-
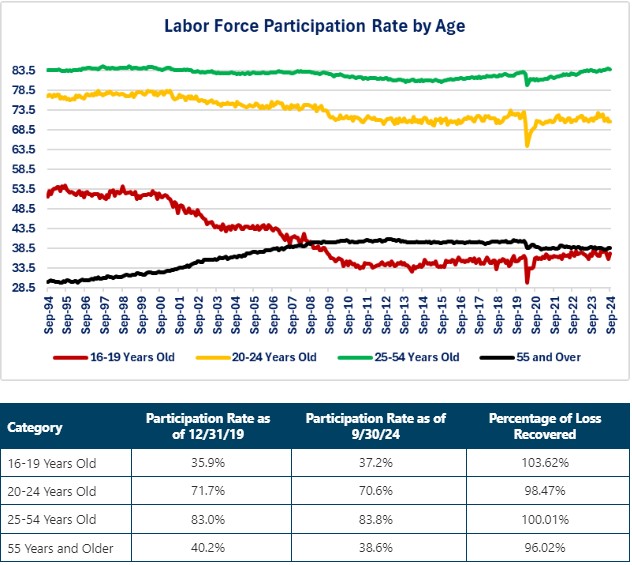
As would be expected, the youngest and oldest age categories have the lowest participation rates but, the youngest age category has shown the strongest improvement since the lows of the pandemic crisis.
-
The 55 and older age category has shown the slowest recovery since the pandemic lows.
-
-
Overall, the higher the level of education the higher the participation in the labor force.
-
Only the lowest level of education has exceeded the participation rate that existed before the pandemic crisis hit.
-
For the other three education categories, the improvement rises as education level rises.
Closing Thoughts
-
The good news is that the age group that is considered the “prime working age” (25-54 years old) has fully recovered from the pandemic lows and is trending higher.
-
A perspective to consider:
- What is the potential increase to the labor force if we simply returned back to the Labor Force Participation rate that existed before the pandemic crisis hit (12/31/2019)?
-
The following table answers that question. It does that for the various categories by calculating the following:
-
Current number of people in the labor force.
-
Labor Force Participation Rate as of 12/31/2019.
-
Number of people that would be in the labor force today if the Labor Force Participation Rate returned to 2019 levels.
-
Potential additional increase to labor force = Level that would exist if we returned to the 2019 rate minus current level. Categories that are already at projected 2019 levels will show -0- since they are already at or above level that would exist if using the 2019 rate.
-
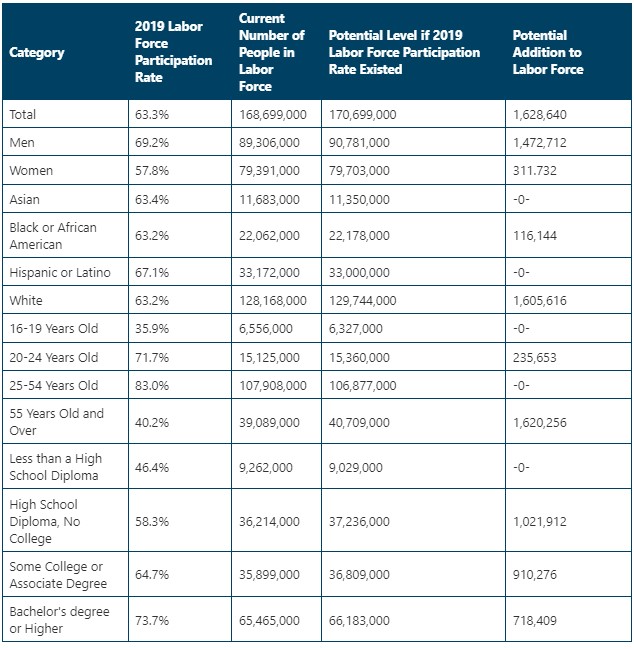
- The table highlights that there is a potential of 1.6 million additional people who could join the workforce if we returned back to the 12/31/2019 Labor Force Participation Rate level.
-
That is easier said than done since there are many factors that may be keeping people from seeking work. Some, but definitely not all reasons include:
-
People with lower education levels returning to school to gain further education.
-
Childcare issues that force someone to stay home to care for their children.
-
Eldercare issues that force someone to stay home to care for the elders.
-
Health issues (including lingering COVID issues)
-
Transportation issues
-
Social issues (family situation, etc.)
-
-
-
If I were to build a composite representation of who business owners may target as they strategize over how to bring them into the labor force it would look like this:
-
White male with a high school diploma but no college education.
-
Of course, that composite is less accurate than a police composite!
-
-
Businesses with continued labor shortage issues may find the Labor Force Participation Rate data useful for brainstorming and strategizing how to reach this potential source of labor.
Economic Data
|
Data |
Time Period Being Reported |
Current Result |
Previous Result |
Comments |
|
10/21/24 |
|
|
|
|
|
Leading Index Monthly Change |
September |
-0.5% |
-0.3% |
Economic conditions weakened based on this index. |
|
10/22/24 |
|
|
|
|
|
Richmond Federal Reserve Manufacturing Activity Index |
October |
-8 |
-18 |
The pace of decline slowed but activity remains negative. |
|
10/24/24 |
|
|
|
|
|
MBA Mortgage Applications Weekly Change |
10/18/24 |
-6.7% |
-17.0% |
Rising mortgage rates resulted in a fourth consecutive week of declines. |
|
10/18/24 |
-5.1% |
-7.2% |
The pace of decline slowed but remained negative. |
|
10/18/24 |
-8.5% |
-26.3% |
Refinancing activity is drying up as mortgage rates remain elevated compared to September. |
|
10/24/24 |
|
|
|
|
|
Chicago Federal Reserve National Activity Index |
September |
-0.28 |
-0.01 |
The index is pointing to slowing economic growth. |
|
Initial Jobless Claims |
10/19/24 |
227,000 |
242,000 |
Filings for initial claims for unemployment insurance continue to stay within a range of 200,000 to 250,000. The current week showed a decline of 15,000. |
|
Continuing Jobless Claims |
10/12/24 |
1,897,000 |
1,869,000 |
Continuing claims rose 28,000. |
|
S&P-Global PMI |
October |
54.3 |
54.0 |
The manufacturing sector led the increases. |
|
October |
47.8 |
47.3 |
Manufacturing is still in contraction mode but showed improvement. |
|
October |
55.3 |
55.2 |
The service sector barely showed improvement. |
|
New Home Sales Monthly Change |
September |
4.1% |
-4.7% |
Activity rebounded as there continues to be a lack of supply in existing homes. |
|
Kansas City Federal Reserve Manufacturing Activity Index |
October |
0 |
-18 |
Manufacturing activity returned to a neutral level. |
|
10/25/24 |
|
|
|
|
|
Durable Goods Orders Monthly Change |
September |
-0.8% |
0.0% |
The Boeing strike had a major impact. |
|
September |
+0.4% |
+0.5% |
Orders remained positive once transportation is excluded. |
|
University of Michigan Consumer Sentiment Index |
October |
70.5 |
70.1 |
Overall sentiment improved slightly. |
|
October |
64.9 |
63.3 |
Consumers sentiment about their current conditions remains low but showed improvement. |
|
October |
74.1 |
72.9 |
Consumers are becoming more optimistic about the future. |

Steve is the Economist for Washington Trust Bank and holds a Chartered Financial Analyst® designation with over 40 years of economic and financial markets experience.
Throughout the Pacific Northwest, Steve is a well-known speaker on the economic conditions and the world financial markets. He also actively participates on committees within the bank to help design strategies and policies related to bank-owned investments.


