Perspectives
Last week's Perspectives section examined one of the Federal Reserve's mandates: stable inflation. What we learned was that inflation has steadily improved from its highs in 2022 but has not reached a stable 2% level that the Federal Reserve is targeting. This week's Perspectives examines the second Federal Reserve mandate: current state of the job markets for each state.
Soundbite
The data sets examined show that most states labor markets are in solid shape as 62% of states have an unemployment rate below 4.0%. When examining current unemployment rates to rates that existed one month before a recession started, the story is the same. When comparing current unemployment rates to rates that existed one month prior to recessions since 1990, in three out of the four recessions, the current unemployment rate is lower than the rate that existed then. The pandemic crisis recession is the outlier. The story is even stronger when examining initial jobless claims. Over 70% of states have initial jobless claims numbers that are lower than where they were one year before a recession started for three out of the last four recessions. Once again, the pandemic crisis recession is the exception. Even though the overall US unemployment rate sits in the range that is considered full employment, the case could be made that for a majority of states, the labor markets are still too tight and lower interest rates may not help that problem.
Observations
There is no specific “full employment” data point that can be measured. Instead, three labor related data sets that are worth examining:
-
Unemployment rate
-
Initial Jobless Claims
-
Ratio of Job Openings to Unemployed People
Since we know that the US does not have a homogenous economy, we have to be careful in judging the health of the economy by only looking at the national level data. State level data helps us better understand forces that have create a bifurcated economy. Of the three data sets listed above, two have state level data-unemployment rate and initial jobless claims. As a result, I will provide information and insights at the state level for those two and national level perspective for the ratio of job openings to unemployed people.
-
Current unemployment rates.
-
Unemployment rate one month before recessions since 1990.
Unemployment Rate=Current
-
Historically, the thought in the economic community has been that an unemployment rate between 4% to 5% represented full employment. Below 4% represented a labor market that was tight and above 5% was an underemployed labor market.
-
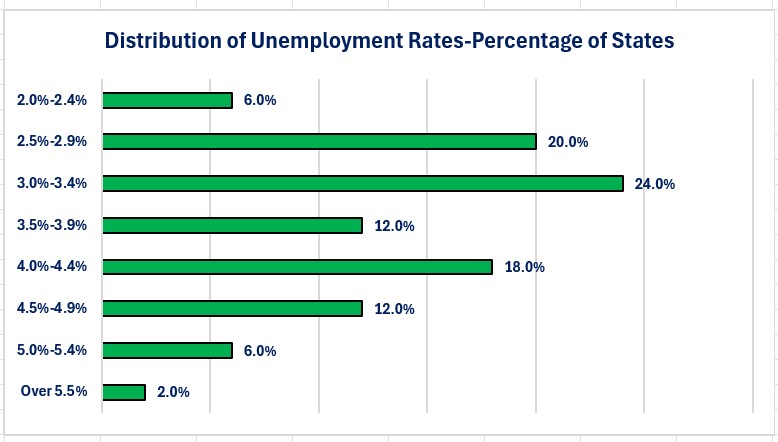
The graphs below show that 62% of the states in the US have unemployment rates below 4%. That implies that for almost two-thirds of the states in the US, the labor markets are more than fully employed. The US unemployment rate is 4.1% which is in the range of full employment
-
South Dakota has the lowest unemployment rate at 2.0%. Nevada has the highest unemployment rate at 5.5%. Four states have unemployment rates over 5% (Nevada=5.5%, California=5.4%, Illinois=5.3%, Kentucky=5.1%).
Unemployment Rate One Month Before Recessions Since 1990
-
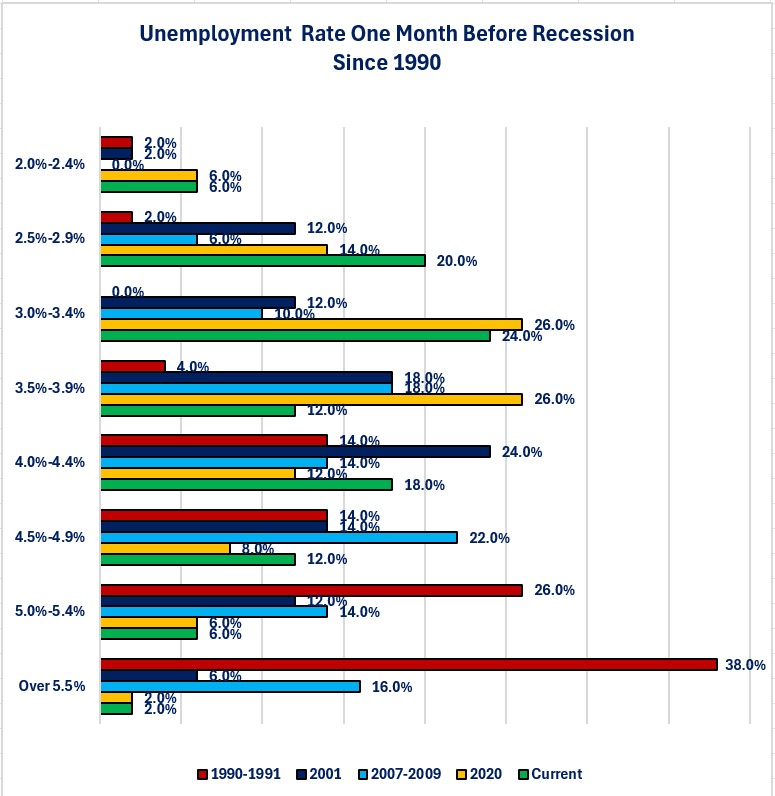
If we compare current unemployment rates to rates that existed one month before each recession since 1990, we can observe that current levels are far better than just before recessions.
-
The pandemic crisis recession is the exception since it was policy induced recession not a naturally occurring recession.
-
-
Currently 62% of states have unemployment rates below 4% while in the month before the 2007-2009, 2001 and 1990-1991 recessions the percentage of states with unemployment rates below 4% ranged between 8% to 44%.
-
Currently only eight states have unemployment rates above 5% while, during the three recessions identified above the percentage ranged between 18% to 64%.
Initial Jobless Claims
-
A second way to evaluate the health of the labor markets is to examine the number of people who have been laid off and filed for initial jobless claims.
-
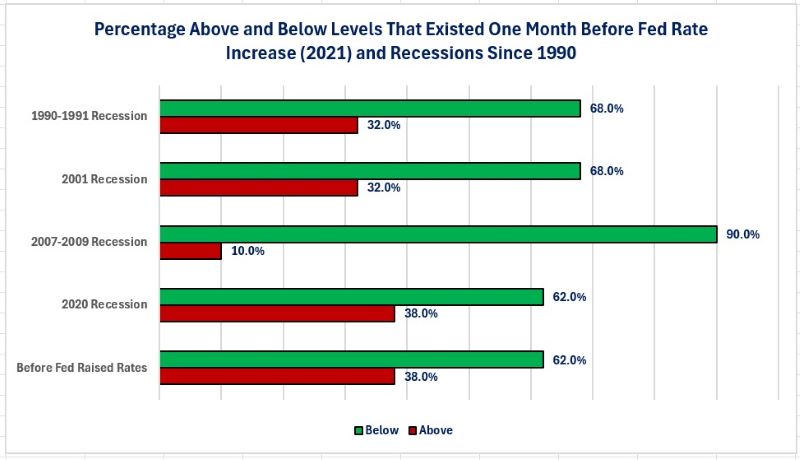
If we examine the current level of jobless claims for each state compared to levels that existed one month before recessions since 1990, we see that it is a similar story to the unemployment rate.
-
The strongest result was comparing current levels to one month before the 2007-2009 recession. This comparison shows that 90% of the states have a current level of initial jobless claims that is below what existed before the 2007-2009 recession. The other three recessions show more than 60% of states with levels better than the month before the recessions.
-
-
I also showed the level of initial claims one month before the Federal Reserve started raising interest rates in 2022.
-
If the interest rate level is highly restrictive, you would expect to see more layoffs and a higher level of initial claims compared to before the rate increases started.
-
In reality, 62% of states have initial claims levels below what existed one month before the rate increases started.
-
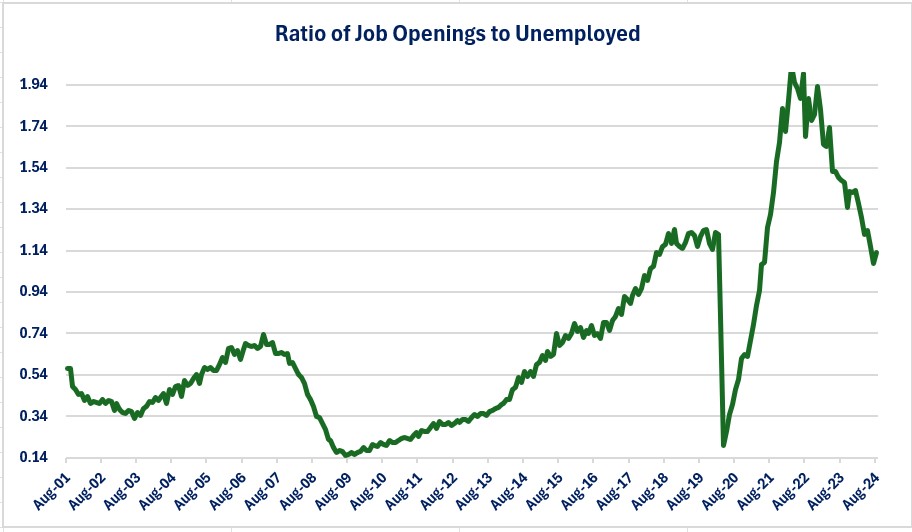
The third economic data set that can be examined is the ratio of job openings versus unemployed people. As discussed above, this can only be examined at the national level.
-
As a general rule of thumb, a ratio of 1.0 is considered full employment since there are always obstacles to employing 100% of the unemployed (i.e., skill set, location, ability to relocate, age, etc.). Less than a 1.0 ratio indicates a tight labor market and above 1.0 indicates an underemployed labor market.
-
The ratio is now close to the full employment level (1.13) and is below the levels that existed before the pandemic crisis.
-
At its tightest, after the pandemic crisis, the ratio was 2.03. That means just over two jobs for every unemployed person. At its loosest the ratio was 0.15 just after the end of the 2007-2009 recession. That means there were almost seven unemployed people for each job opening.
-
This current level indicates that we have moved away from the extremely tight labor market that occurred after the pandemic crisis and are now at or very near full employment.
Closing Thoughts
- Last week's Perspectives showed that the Federal Reserve's mandate of stable inflation is progressing but not yet achieved.
-
This week's Perspectives shows that, at a national level the labor market appears to be close to full employment and this mandate has essentially been achieved.
-
The national unemployment rate is 4.1%
-
Initial jobless claims have stayed in a range of 200,000 to 250,000.
-
The ratio of job openings to unemployed people is close to 1.0 (1.13)
-
-
The story is different when examining the data at a state level. From a state level perspective, the majority of states still have tight labor markets.
-
Over 60% of states have unemployment rates below 4% and initial jobless claims levels lower than where they were one month before the last four recessions.
-
-
A tight labor market poses risks for states experiencing that condition.
-
A tight labor market creates the risk that companies will need to continue raising wages to attract and retain employees.
-
Higher wage increases risks companies passing those increases through to the price of their products.
-
Many businesses still bear the “scars” from what happened with wages and prices after the pandemic crisis ended and the job openings to unemployed people hit 2.03.
-
-
The challenge/opportunity for states with tight labor markets is to find ways to attract people to their states in order to create a bigger labor pool and relieve the stress on businesses created by a tight labor market.
-
Similar to the challenge that lack of affordable shelter presents to a state for future economic growth, lack of a sufficient labor force can be an impediment to future growth if it persists.
-
-
Those states that successfully address these types of challenges will be the states that prosper and grow while those that do not face the risk of stagnation and/or decline.
-
As I said with affordable shelter, finding these solutions will require setting aside personal and/or political agendas and bringing all stakeholders together to create a successful economic agenda.
-
Economic Data
|
Data |
Time Period Being Reported |
Current Result |
Previous Result |
Comments |
|
10/16/24 |
|
|
|
|
|
Import Prices Year-Over-Year Change |
September |
-0.1% |
+0.8% |
US businesses who buy imported goods and services experienced a slight decline in import prices. |
|
Export Prices Year-Over-Year Change |
September |
-0.7% |
-0.9% |
US exporters continue to see price declines for the goods and services they are exporting. |
|
MBA Mortgage Applications Weekly Change |
10/9/24 |
-17.0% |
-5.1% |
A steep decline in application to refinance drove the overall decline. |
|
10/9/24 |
-7.0% |
+1.0% |
Buyers moved to the sidelines as mortgage rates continue to rise in line with increases in US Treasury security yields. |
|
10/9/24 |
-26.0% |
-3.0% |
Demand to refinance fell sharply as mortgage rates rose. |
|
10/17/24 |
|
|
|
|
|
Retail Sales Year-Over-Year Change |
September |
+1.74% |
+2.16% |
The pace of spending has slowed slightly but, the consumer is still spending. |
|
Initial Jobless Claims |
10/10/24 |
241,000 |
260,000 |
Initial claims fell by 19,000. |
|
Continuing Jobless Claims |
10/3/24 |
1,867,000 |
1,858,000 |
Continuing claims rose by 9,000. |
|
Philadelphia Federal Reserve Manufacturing Index |
October |
10.3 |
1.7 |
Manufacturing activity shows a solid increase in October. |
|
Industrial Production Year-Over-Year Change |
September |
-0.64% |
-0.16% |
Industrial production was impacted by the Boeing strike and Hurricane Helene. |
|
September |
-0.4% |
+0.5% |
The Boeing strike had the biggest impact to the manufacturing component of industrial production. |
|
NAHB Housing Index |
October |
43 |
41 |
Lower costs for raw materials and hope for more interest cuts made builders more optimistic about the housing market. |
|
10/18/24 |
|
|
|
|
|
Housing Starts Monthly Change |
September |
-0.5% |
+7.8% |
Single family starts rose 2.7% but, multifamily starts fell 4.5%. |
|
Building Permits Monthly Change |
September |
-2.9% |
+4.6% |
Single family permits rose 0.3% while multi-family permits fell 10.8% |

Steve is the Economist for Washington Trust Bank and holds a Chartered Financial Analyst® designation with over 40 years of economic and financial markets experience.
Throughout the Pacific Northwest, Steve is a well-known speaker on the economic conditions and the world financial markets. He also actively participates on committees within the bank to help design strategies and policies related to bank-owned investments.


