Perspectives
Soundbite
Observations
The data is from the Census Bureau. The Census Bureau categorizes race as follows:
-
American Indian or Alaska Native
-
Asian
-
Black or African American
-
Hispanic or Latino
-
Some Other Race
-
Two or More Races
-
White
-
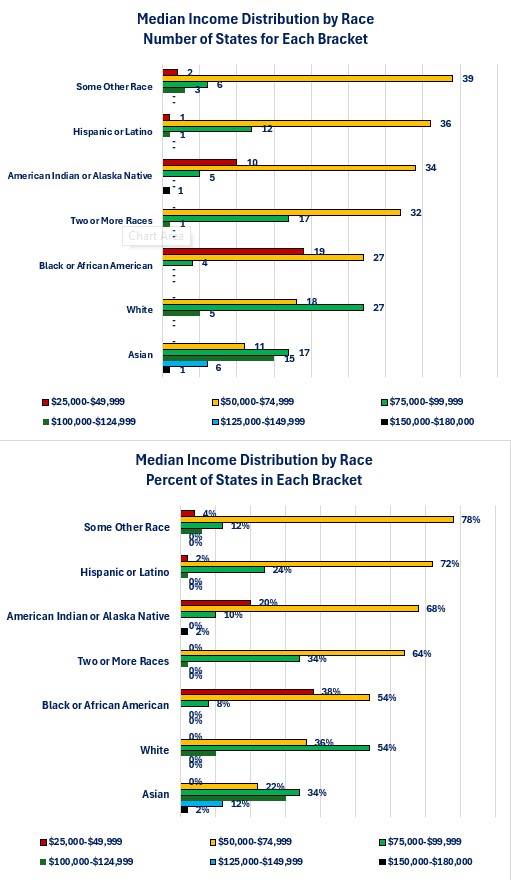
All race categories have median incomes in the $50,000-$75,000 category in the most states.
-
There are no states where the median income for the Asian race category falls into the $25,000-$49,999 category while there are 19 states (38%) where the median income for the Black or African American race category with median incomes in this category.

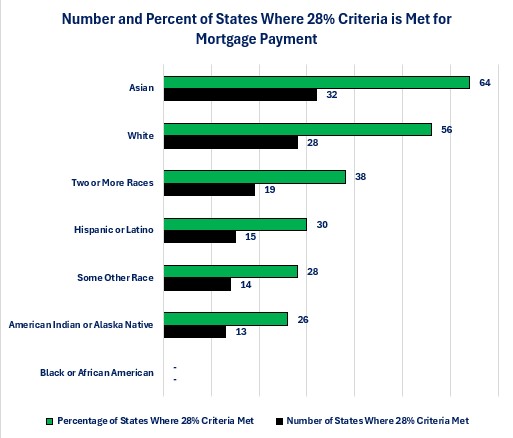
Number and Percentage of States Where the 28% Criteria is Met-Mortgage Payments
- Based on median income, there is no state in the US where a Black or African American would meet the 28% mortgage payment/median income criteria, while there a 32 states (64%) where an Asian would qualify.

-
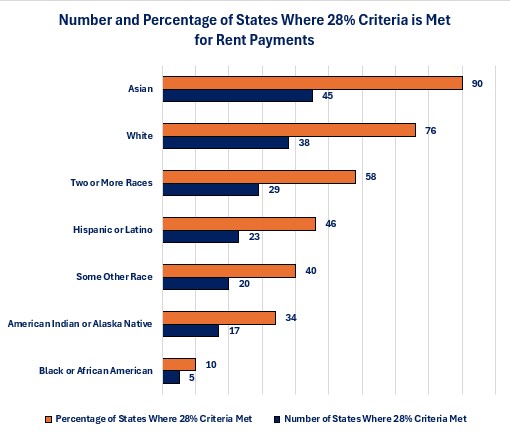
The story is only slightly better when considering rent. In this case, there are only 5 state (10%) where the median income for a Black of Native American meets the 28% criteria, while there are 45 states (90%) where the median income of an Asian would meet the criteria.

Closing Thoughts
- Examining shelter affordability by race illustrates another example of bifurcation within the economy.
- There is a $54,877 gap between the highest median income state for the Asian race category ($151,483) versus the Black or African American race category ($96,606).
-
There is a $17,933 gap between the lowest median income state for the Asian race category ($53,223) versus the Black or African American race category ($35,290).
-
I won't repeat most of the thoughts that I have expressed in the last two Economic Perspectives newsletters other than to simply repeat that when shelter becomes unaffordable, out-migration from expensive states to affordable states becomes a risk for the expensive states and a potential opportunity for the affordable states.
-
Examining the data both by income (last week) and race (this week) continues to remind us that we are not all in the same financial situation when it comes to affordable shelter.
-
Lower interest rates are not the solution to shelter affordability. They are part of a solution as, all else being equal, lower mortgage rates result in lower mortgage payments and result in more people qualifying under the 28% criteria.
-
The decision by the Federal Reserve to begin lowering its overnight borrowing rate does not guarantee that mortgage rates will decrease and has little impact on how landlords determine rent prices.
-
The Federal Reserve has direct control over short-term interest rates. Long-term interest rates (i.e. fixed rate mortgages) are determined by a variety of other factors.
-
-
-
As I stated before, finding a solution to affordable shelter will require all stakeholders to come together and agree to compromise to find the best overall solution.
-
Government
-
Builders
-
Buyers/Renters
-
Neighborhoods
-
-
The goal of raising awareness of the problem is to help facilitate a more objective discussion versus an emotional argument between all stakeholders.
Economic Data
|
Data |
Time Period Being Report |
Current Results |
Previous Results |
Comments |
|
9/30/24 |
|
|
|
|
|
Dallas Federal Reserve Manufacturing Activity Index |
September |
-9.0 |
-9.7 |
Activity improved slightly but remains negative. |
|
10/1/24 |
|
|
|
|
|
S&P-Global Manufacturing PMI Index |
September |
47.3 |
47.9 |
Manufacturing activity in the US slipped further into contraction. |
|
ISM Manufacturing PMI Index |
September |
47.2 |
47.2 |
This version of manufacturing showed activity remains in contraction mode but did not deteriorate further. |
|
Construction Spending Monthly Change |
August |
-0.1% |
-0.5% |
High interest rates continue to constrain construction spending. |
|
Job Opening & Labor Turnover (JOLTS) Report |
August |
8,040,000 |
7,711,000 |
The number of job openings increased in August. |
|
10/2/24 |
|
|
|
|
|
MBA Mortgage Applications Weekly Change |
9/27/24 |
-1.3% |
+11.0% |
After a run of strong growth over the past month, applications fell slightly last week. |
|
9/27/24 |
+1.0% |
+9.0% |
Applications to purchase a house continued to rise, albeit at a slower pace. |
|
9/27/24 |
-3.0% |
+24.0% |
Without a further decrease in mortgage rates, applications fell. |
|
ADP Nonfarm Payroll Monthly Change |
September |
143,000 |
103,000 |
The growth in jobs increased the most in three months. |
|
10/3/24 |
|
|
|
|
|
Challenger Jobs Cut Year-Over-Year Change |
September |
+53.4% |
+1.0% |
The amount of announced planned for layoffs surged. It remains to be seen if all planned layoffs happen. |
|
Initial Jobless Claims |
9/28/24 |
225,000 |
219,000 |
Initial claims rose 6,000. |
|
Continued Jobless Claims |
9/21/24 |
1,826,000 |
1,827,000 |
Continued claims declined 1,000. |
|
Factory Orders Monthly Change |
August |
-0.2% |
+5.0% |
Excluding the volatile transportation sector, factory orders fell 0.1%. |
|
ISM Non-Manufacturing PMI Index |
September |
54.9 |
51.5 |
This is the fastest pace of expansion since February 2023. |
|
10/4/24 |
|
|
|
|
|
Nonfarm Payrolls Monthly Change |
September |
254,000 |
159,000 |
The strength in jobs growth makes the possibility of the Federal Reserve lowering its overnight borrowing rate by 0.50% at its November meeting far less likely. |
|
Average Weekly Earnings Year-Over-Year Change |
September |
+3.4% |
+3.5% |
Construction experienced the strongest wage growth at 4.9% while Retail Trade experienced the slowest at 0.9%. |
|
Unemployment Rate |
September |
4.1% |
4.2% |
The unemployment rate decreased by 0.1% as employment growth was stronger than labor force growth. |

Steve is the Economist for Washington Trust Bank and holds a Chartered Financial Analyst® designation with over 40 years of economic and financial markets experience.
Throughout the Pacific Northwest, Steve is a well-known speaker on the economic conditions and the world financial markets. He also actively participates on committees within the bank to help design strategies and policies related to bank-owned investments.


