Perspectives
Soundbite
Observations
The data comes from the same Census Bureau survey used for last week. It is simply using a more detailed section of the survey.
-
15-24 years old
-
25-44 years old
-
45-64-years old
-
65 years and older
-
As you can see, the picture improves for the top ten Least Affordable states but still leaves them as unaffordable.
|
|
Median Mortgage as % of Median Income State Level |
Median Mortgage as % of Median Income 25-44 Years Old |
Median Mortgage as % of Median Income 45-64 Years Old |
|
New York |
77.3% |
56.9% |
53.2% |
|
Hawaii |
72.7% |
53.3% |
50.1% |
|
California |
68.8% |
49.0% |
45.5% |
|
Washington |
51.2% |
39.1% |
37.5% |
|
Massachusetts |
50.3% |
35.1% |
33.1% |
|
Montana |
48.4% |
38.9% |
37.7% |
|
Oregon |
47.9% |
37.4% |
35.1% |
|
Idaho |
46.9% |
37.7% |
32.5% |
|
Colorado |
46.5% |
36.0% |
32.3% |
|
Utah |
44.1% |
35.4% |
30.6% |
Most Affordable-Mortgage Payments
-
The top ten Most Affordable states become more attractive when examining these two age groups.
|
|
Median Mortgage as a Percentage of Median Income State Level |
Median Mortgage as a Percentage of Median Income 25-44 Years Old |
Median Mortgage as a Percentage of Median Income 45-64 Years Old |
|
Indiana |
26.2% |
20.7% |
19.4% |
|
Illinois |
25.9% |
18.9% |
18.1% |
|
North Dakota |
25.2% |
19.8% |
19.6% |
|
Ohio |
24.8% |
19.3% |
18.1% |
|
Kansas |
24.6% |
19.2% |
17.1% |
|
Kentucky |
24.6% |
18.9% |
19.3% |
|
Oklahoma |
24.3% |
19.5% |
18.8% |
|
Iowa |
24.2% |
18.1% |
16.9% |
|
Mississippi |
23.9% |
20.3% |
18.8% |
|
West Virginia |
19.8% |
16.5% |
16.6% |
Least Affordable-Rents
-
Three of the top 10 Least Affordable states become affordable for rent when examining the 25-44 year age group.
-
Half of the top ten Least Affordable states become affordable for the 45-64 year age group.
|
|
Rent as a Percentage of Median Income State Level |
Rent as a Percentage of Median Income 25-44 Years Old |
Rent as a Percentage of Median Income 45-64 Years Old |
|
New York |
59.3% |
40.8% |
40.7% |
|
Florida |
47.2% |
36.7% |
34.4% |
|
Massachusetts |
46.0% |
32.1% |
30.3% |
|
California |
45.4% |
32.3% |
30.0% |
|
Hawaii |
41.3% |
32.3% |
28.5% |
|
Georgia |
40.3% |
30.0% |
26.8% |
|
New Mexico |
38.6% |
30.4% |
27.4% |
|
Texas |
36.8% |
27.7% |
24.8% |
|
Maine |
35.8% |
27.6% |
27.2% |
|
Arizona |
34.8% |
27.5% |
25.1% |
Most Affordable-Rents
-
Just like the mortgage payment category, all of the top ten Most Affordable states become more affordable and more attractive.
|
|
Rent as a Percentage of Median Income State Level |
Rent as a Percentage of Median Income 25-44 Years Old |
Rent as a Percentage of Median Income 45-64 Years Old |
|
South Dakota |
25.8% |
19.5% |
17.0% |
|
Nebraska |
24.6% |
18.3% |
16.9% |
|
Ohio |
24.5% |
19.1% |
17.9% |
|
Missouri |
24.4% |
18.6% |
18.0% |
|
Kansas |
23.4% |
18.2% |
16.2% |
|
Wyoming |
23.4% |
17.6% |
16.4% |
|
Wisconsin |
22.6% |
17.1% |
16.0% |
|
West Virginia |
21.6% |
18.2% |
18.0% |
|
Iowa |
21.5% |
16.1% |
15.0% |
|
North Dakota |
16.0% |
12.6% |
12.5% |
Median Income
-
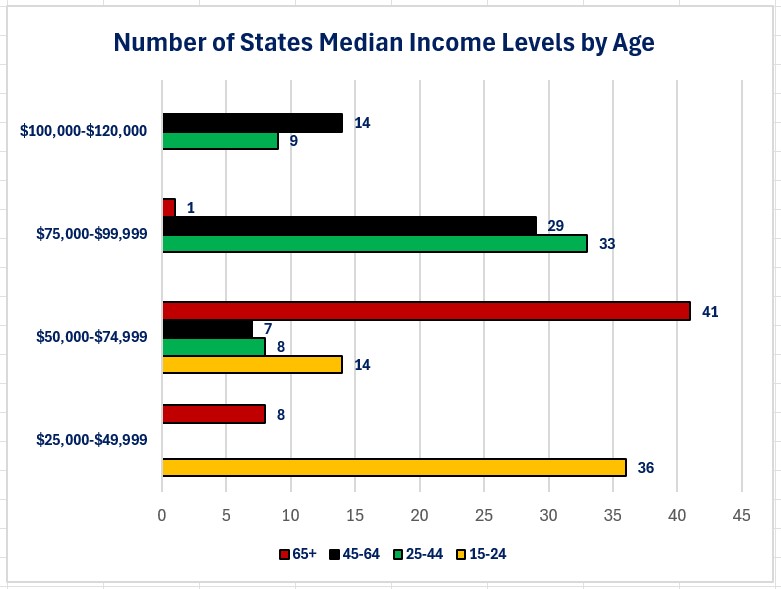
72% of states (36 states) have people between the ages of 15-24 who receive income of less than $50,000 while 82% of states (41 states) have people over the age of 65 earning $50,000-$74,999.
-
This compares to 84% states (42) have people between the ages of 25-44 who receive income over $75,000 and 86% of states (43) have people between the ages of 45-64 who receive income over $75,000.

Mortgage Payments as a Percentage of Income by Age
-
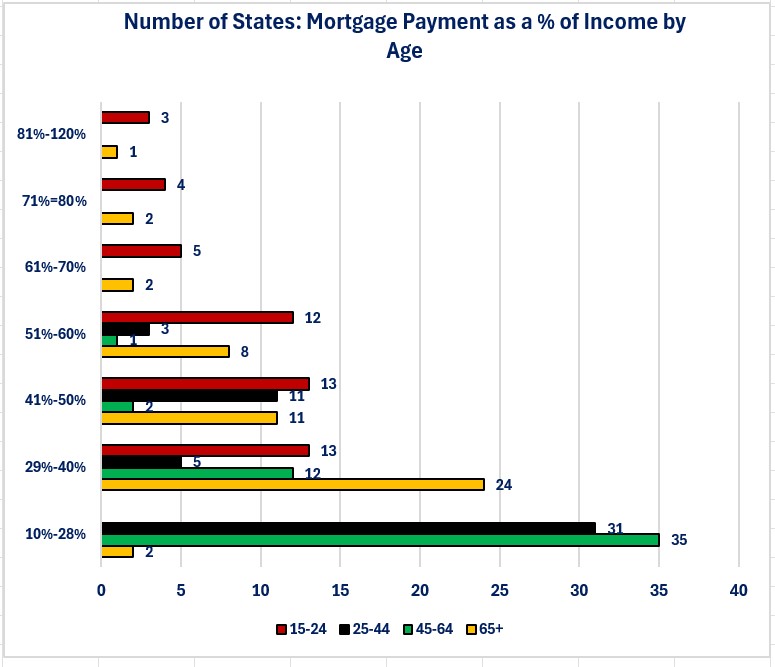
Mortgage payments are unaffordable in all states for people between the age or 15-24.
-
That compares to 70% of states (35 states) that offer affordable mortgage payments for people between the age of 45-64 based on the 28% criteria.

Rent as a Percentage of Income by Age
-
90% of states (45 states) offer affordable rent for people between the age of 45-64 based on the 28% criteria, while only 5% of states (2 states) offer affordable rent for people between the age of 15-24.

Closing Thoughts
- When shelter affordability is examined by age group, we see the pattern of bifurcation that has been discussed with other economic data.
-
Shelter is more affordable for people between the age of 25-64 and is less affordable for the youngest (15-24 years old) and the oldest (65 and over).
-
-
It would be a mistake to think that the youngest and oldest age groups don't need shelter.
-
Not all of the youngest age group live with their parents.
-
The oldest age group still need shelter as well.
-
In general, the US does not have the extended family structure that other countries may have so the youngest and oldest age groups cannot necessarily depend on their parents or grown kids to provide them shelter.
-
-
-
Examining the “prime working” age group (25-64 years old) shows that this group of people earn higher median income than the overall median income of a state.
-
This is logical since this age group is generally considered to be in their prime earning years for their jobs.
-
As a result, shelter is more affordable in more states for this age group.
-
-
Last week we learned that only six states (12%) met the 28% rule for qualifying for a mortgage using one income earner.
-
Today's data shows that for the 25-44 year age bracket, twenty-eight states (56%) meet the 28% rule and thirty-five states (87.5%) meet the 28% rule for the 45-64 year age bracket.
-
-
Last week showed that nineteen states (38%) would meet the 28% rule for rent payments.
-
This week shows that forty-one states (82%) meet the 28% rule and forty-five (90%) meet it with the 45-64 year age bracket.
-
-
When considering these two age groups the overall affordability issue for shelter improves but does not go away. Unfortunately, for the oldest and youngest age groups, shelter affordability remains a key issue.
-
The least affordable states face the risk that the prime working age group (i.e., 25-64 years old) has more options when examining states that offer affordable shelter for them.
-
Clearly, there are many factors that ultimately determine if someone is willing to relocate to another state, but affordable shelter is one factor supporting a move.
-
From an economic standpoint, the worst thing that could happen to a state is to lose its prime working age group population due to lack of affordable housing.
-
Economic Data
|
|
Time Period Reported |
Current Result |
Previous Result |
Comments |
|
9/23/24 |
|
|
||
|
Chicago Federal Reserve National Activity Index |
August |
0.12 |
-0.42 |
After two consecutive months of decline, the index rose into positive territory |
|
S&P Global Purchasing Managers Index (PMI) |
Sept |
54.4 |
54.6 |
Slight slowing in activity in September compared to August. |
|
September |
47.0 |
47.9 |
Manufacturing activity fell further into negative territory. |
|
September |
55.4 |
55.7 |
Activity slowed but, remained positive. |
|
9/24/24 |
|
|
||
|
FHFA Home Price Index Year-Over-Year Change |
July |
+4.5% |
+5.1% |
New home buyers continued to be frustrated by the increase in home prices. |
|
S&P Case Schiller Home Price Index Year-Over-Year Change |
July |
+5.9% |
+6.5% |
The S&P Case Shiller index showed similar results to the FHFA index. |
|
Consumer Confidence Index |
September |
98.7 |
105.6 |
Perhaps the consumer thinks the Federal Reserve knows something that they do not know. |
|
Richmond Federal Reserve Manufacturing Index |
September |
-21 |
-19 |
This is the 11th consecutive month of declines. |
|
9/25/24 |
|
|
||
|
MBA Mortgage Applications |
9/230/24 |
+11.0% |
+14.2% |
The second consecutive week of surging applications was all due to refinancing activity. |
|
9/20/24 |
+1.0% |
+5.0% |
Applications increased for a fourth consecutive week. |
|
9/20/24 |
+20.0% |
+24.0% |
The drop in mortgage rates has triggered a wave of refinancing. |
|
New Home Sales Monthly Change |
August |
-4.7% |
+10.3% |
Sales fell back after the strong surge in July. |
|
9/26/24 |
|
|
||
|
Initial Jobless Claims |
9/21/24 |
218,000 |
222,000 |
For those arguing that the labor market is weakening, it is not evident when examining people filing for unemployment insurance claims. |
|
Continuing Jobless Claims |
9/14/24 |
1,834,000 |
1,821,000 |
Continuing claims rose 13,000. |
|
Real GDP (final revision) |
2nd Quarter |
+3.0% |
+1.4% |
No change from the previous revision. |
|
Durable Goods Orders Monthly Change |
August |
0.0% |
+9.9% |
Transportation orders were the culprit. |
|
August |
+0.5% |
-0.1% |
Excluding transportation orders, core orders rose. |
|
Pending Home Sales Monthly Change |
August |
+0.6% |
-5.5% |
All regions of the US rose except for a 4.6% decline in the Northeast. |
|
9/27/24 |
|
|
||
|
PCE Price Index Year-Over-Year Change |
August |
+2.2% |
+2.5% |
Lower energy prices pushed the annual rate lower. |
|
August |
+0.1% |
+0.2% |
Goods inflation fell 0.2% while service inflation rose 0.2%. |
|
Core PCI Price Index Year-Over-Year Change |
August |
+2.7% |
+2.6% |
Not the direction the Federal Reserve wants to see. |
|
August |
+0.1% |
+0.2% |
Service inflation rose 0.2$% while goods inflation rose less than 0.1% |
|
Personal Income Year-Over-Year Change |
August |
+5.6% |
+4.5% |
Income growth finally outpaced spending growth. |
|
Real Disposable Personal Income Year-Over-Year Change |
August |
+3.1% |
+1.1% |
Income growth was still strong after adjusting for inflation and taxes. |
|
Personal Spending Year-Over-Year Change |
August |
+5.2% |
+5.3% |
Spending slowed on a nominal basis (before adjusting for inflation) |
|
Real Personal Spending Year-Over-Year Change |
August |
2.9% |
+2.7% |
Spending was actually stronger after adjusting for inflation. |
|
Trade Balance |
August |
-94.26 Billion |
-$102.66 Billion |
A reduction in the trade balance will increase GDP growth. |
|
Retail Inventory Monthly Change |
August |
+0.4% |
+0.5% |
Retailers slowed their inventory growth slightly. |
|
Wholesale Inventory Monthly Change |
August |
+0.2% |
+0.2% |
Wholesalers grew their inventory at the same pace as last month. |
|
University of Michigan Consumer Sentiment Index |
September |
70.1 |
67.9 |
The increase was due entirely to a rise in optimism for future conditions. |
|
September |
63.3 |
67.3 |
Consumers grew more pessimistic about their current conditions. |
|
September |
74.4 |
72.1 |
Consumers became more optimistic about their outlook for the future. |

Steve is the Economist for Washington Trust Bank and holds a Chartered Financial Analyst® designation with over 40 years of economic and financial markets experience.
Throughout the Pacific Northwest, Steve is a well-known speaker on the economic conditions and the world financial markets. He also actively participates on committees within the bank to help design strategies and policies related to bank-owned investments.


