Perspectives
- Stable Inflation
- Full Employment
Soundbite
The Federal Reserve has communicated that it is confident that core inflation is progressing toward its 2% target and that this confidence one of the reasons that led to it cutting its overnight borrowing rate. The inflation data may not inspire as much confidence for the average consumer, especially when you examine tat components of inflation that they may care about the most: food, energy, shelter, utilities, day care and insurance.
Observations
The Federal Reserve monitors two inflation measures to help determine its monetary policy.
- Consumer Price Index (CPI)
- Personal Consumption Expenditures (PCE) Index
For both of these indices, it has communicated that it focuses on the “core” part of the index. The core indices exclude food and energy prices.
The data is from the Bureau of Labor Statistics.
- Core CPI is as of 9/30/24.
- Core PCE is as of 8/31/24 as the September data will not be released until later this month.
The major difference between the two inflation indices is that the CPI has a heavier weighting towards shelter price compared the PCE index.
There are two ways to look at the inflation indices to examine progress towards the Federal Reserve's 2% goal.
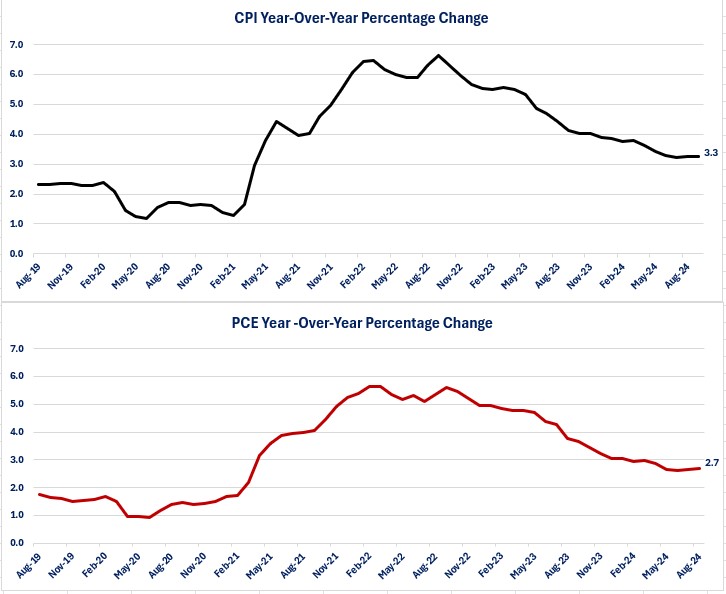
- This measures how the inflation has grown (or fallen) compared to the same time last year.
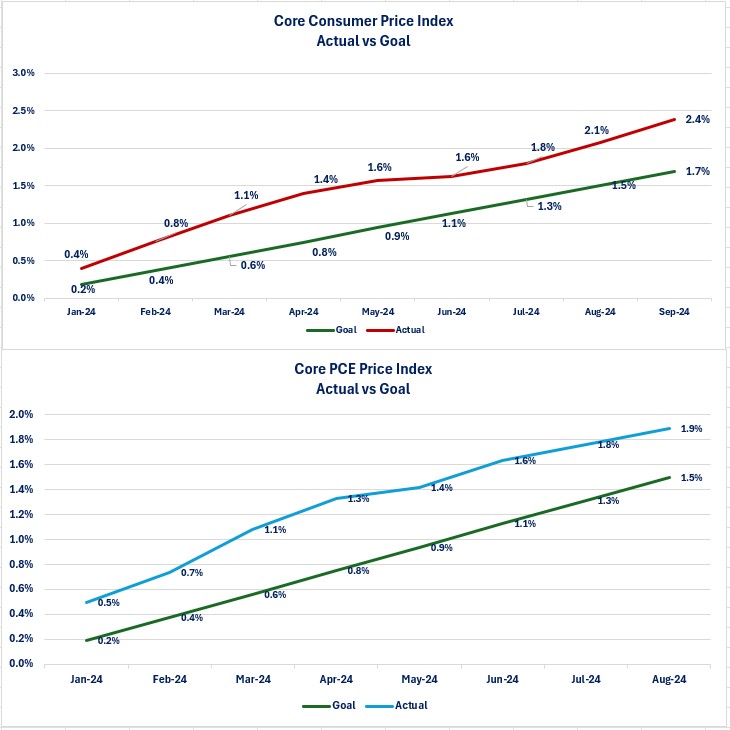
- This measures how inflation has grown or fallen for the current year.
- The year-over-year inflation rate clearly shows progress from the highs that happened in 2022.
-
The year-over-year inflation rate is not near the 2% target yet and, since May, the progress appears to have stalled.
- The year-to-date rate for core CPI has already exceeded the 2% target and there are still three months left.
-
The year-to-date rate for core PCE is almost at target through August. If core PCE shows the same type of growth in September as core CPI, it will also be over target.
-
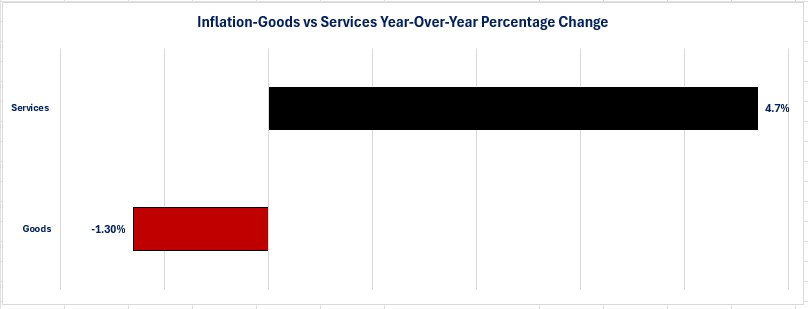
If we breakdown the two major components of inflation (Goods vs Services), it is clear that the problem with inflation lies on the Services side as falling energy prices have driven the Goods component of inflation into negative territory.
-
Since food and energy are excluded from core CPI and PCE, falling energy prices have not helped the core numbers.
-
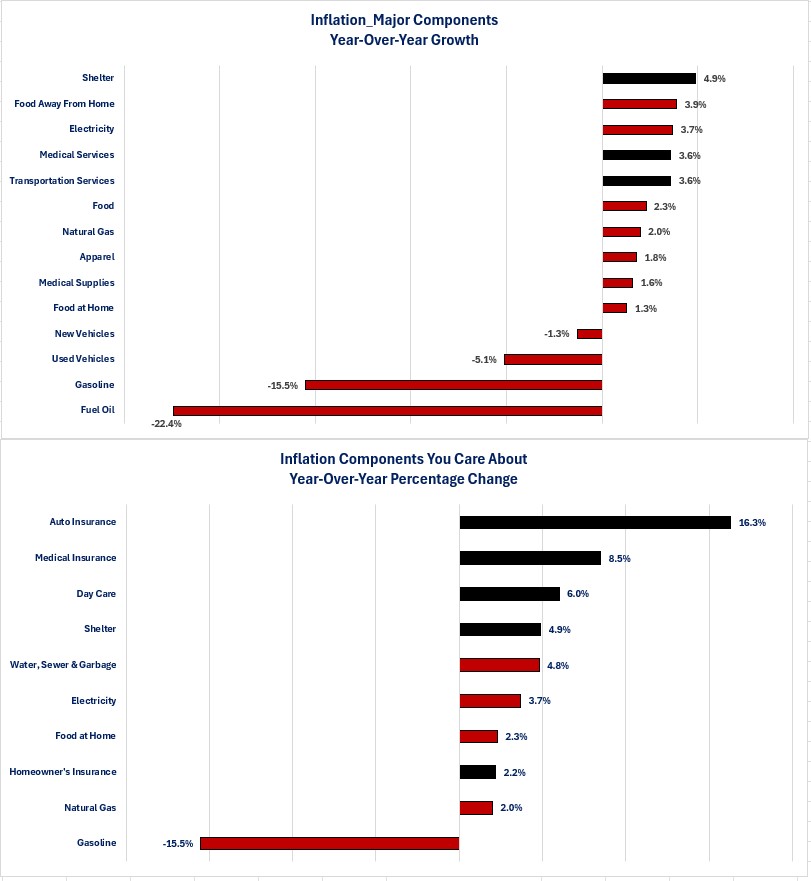
If we examine the major components of inflation (as defined by the Bureau of Labor Statistics), we gain a better perspective of where progress is still needed.
-
Many economists and news stories dismiss the problem with Services inflation as being strictly a problem with shelter prices because of the large weighting that Shelter has in the calculation of inflation.
-
-
The Major Components graph shows that the inflation rate is above 2% for six out of the fourteen major components. For the average consumer it is not “just a shelter problem” when it comes to inflation.
-
If we look at the components that the average consumer probably cares about the most, we can see that eight out of the ten components have an inflation rate above 2%.
Closing Thoughts
-
In reality, there is no true “national” inflation rate.
-
Nobody buys all of the items included in the official inflation indices or in the weighting used to calculate the rates.
-
Each person experiences their own inflation rate depending on what they buy and how much.
-
-
The charts highlight this when we look at some of the components of inflation that most consumers care about: food, energy, shelter, utilities, day care and insurance.
-
An argument can also be made that there are flaws in the two official inflation indices as well as other alternative measures used to try and gauge inflation.
-
Whether we think the inflation indices are accurate is a great topic for conversation but, in reality it is irrelevant for monetary policy.
-
The Federal Reserve monitors the two official inflation indices and the results of these indices plays a role in setting monetary policy.
-
As a result, it is important to understand what the results are for the two indices since the results will play a role in measuring whether the Federal Reserve is meeting its “stable inflation” mandate and how they determine monetary policy.
-
-
What gets missed in focusing on the inflation rate is the impact of where prices are now. Even if inflation were running at a zero percent rate, prices are now higher than before the pandemic crisis and for many consumers the dollar increase in their wages has not kept up with the dollar increase of the goods and services they buy.
-
It is important to remember that lower interest rates do not directly cause inflation to slow.
-
Historically inflation slows (or falls) when demand for goods and services slows or falls.
-
-
The Federal Reserve has communicated its confidence that the inflation rate is progressing towards its target level. The real question is whether the average consumer has confidence that prices are progressing to levels that fit their budget.
-
If they do, then consumer spending may continue at or near the 3% pace that is currently occurring.
-
If they do not, then spending could slow even if interest rates decline.
-
Economic Data
|
Data |
Time Period Being Reported |
Current Results |
Previous Results |
Comments |
|
10/7/24 |
|
|
|
|
|
Consumer Credit |
August |
$8.95 billion |
$26.63 billion |
Revolving credit fell 1.2% while non-revolving credit rose 3.3% |
|
10/8/24 |
|
|
|
|
|
NFIB Small Business Optimism Index |
September |
91.5 |
91.2 |
Inflation remains the biggest obstacle for small businesses. |
|
Trade Deficit |
August |
-$70.4 billon |
-$78.9 billion |
The combination of imports falling and exports rising led to the decline. |
|
August |
$271.8 billion |
$266.6 billion |
A weaker dollar in August helped boost exports. |
|
August |
$342.2 billion |
$345.4 billion |
Imports declined $3.2 billion |
|
10/9/24 |
|
|
|
|
|
MBA Mortgage Applications Weekly Change |
10/4/24 |
-5.1% |
-1.3% |
This is the second straight week of declines. |
|
10/4/24 |
+0.07% |
+1.0% |
Application to buy a house were essentially unchanged. |
|
10/4/24 |
-9..3% |
-3.0% |
A rise in mortgage rates caused the decline in refinancing applications. |
|
Wholesales Sales Monthly Change |
August |
-0.1% |
+1.1% |
Sales fell in August. |
|
Wholesale Inventories Monthly Change |
August |
+0.1% |
+0.2% |
The decline in sales resulted in an increase in inventories. |
|
10/10/24 |
|
|
|
|
|
Real Average Hourly Earnings Year-Over-Year Change |
September |
+1.5% |
+1.4% |
Hourly earnings adjusted for inflation continued to grow. |
|
Real Average Weekly Earnings Year-Over-Year Change |
September |
+0.9% |
+1.0% |
A reduction in the average work week resulted in a slower pace of growth for weekly earnings adjusted for inflation. |
|
Initial Jobless Claims Weekly Change |
10/5/24 |
255,000 |
228.000 |
The increase in claims was due to the impact of Helene and the Boeing strike. |
|
Continued Jobless Claims Weekly Change |
9/28/24 |
1,861,000 |
1,819,000 |
The same distortions occurred with continued claims. |
|
Consumer Price Index Year-Over-Year Change |
September |
+2.4% |
2.5% |
Lower energy prices drove the slower pace of growth. |
|
Core Consumer Price Index Year-Over-Year Change |
September |
+3.3% |
+3.2% |
Service sector inflation drove the increase in the pace of growth. |
|
10/11/24 |
|
|
|
|
|
Producer Price Index Year-Over-Year Change |
September |
+1.8% |
+1.7% |
Inflation for goods fell 1.1% but inflation for services rose 3.1% |
|
Core Producer Price Index Year-Over-Year Change |
September |
+2.8% |
+2.4% |
Inflation for services drove the increase. |
|
University of Michigan Consumer Sentiment Index |
September |
68.9 |
70.1 |
Lower interest rates did not inspire more confidence from the consumer. |
|
September |
62.7 |
63.3 |
The consumer has grown less confident about their current situation. |
|
September |
72.9 |
74.4 |
Confidence fell even more regarding their outlook for the future. |

Steve is the Economist for Washington Trust Bank and holds a Chartered Financial Analyst® designation with over 40 years of economic and financial markets experience.
Throughout the Pacific Northwest, Steve is a well-known speaker on the economic conditions and the world financial markets. He also actively participates on committees within the bank to help design strategies and policies related to bank-owned investments.


