Perspectives
- The employment report last Friday came in well below expectations.
- The unemployment rate rose to a level that triggered a recession indicator to move into the “red” warning level.
- Economic date series
- Nonfarm Payroll
- Employment
- Industrial Production
- Real Manufacturing and Trade Industry Sales
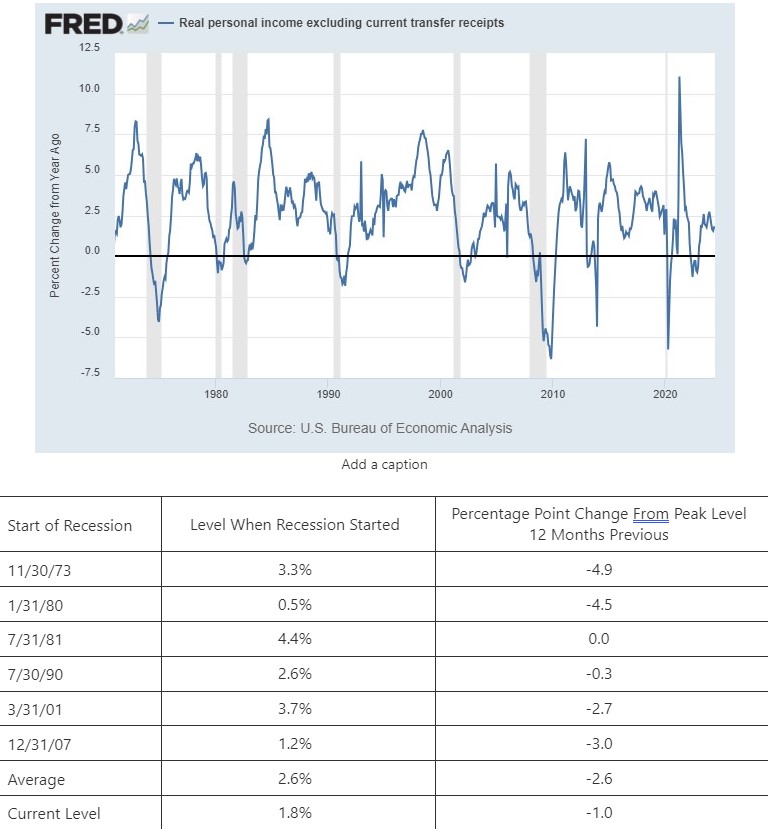
- Real Personal Income Excluding Transfer Payments
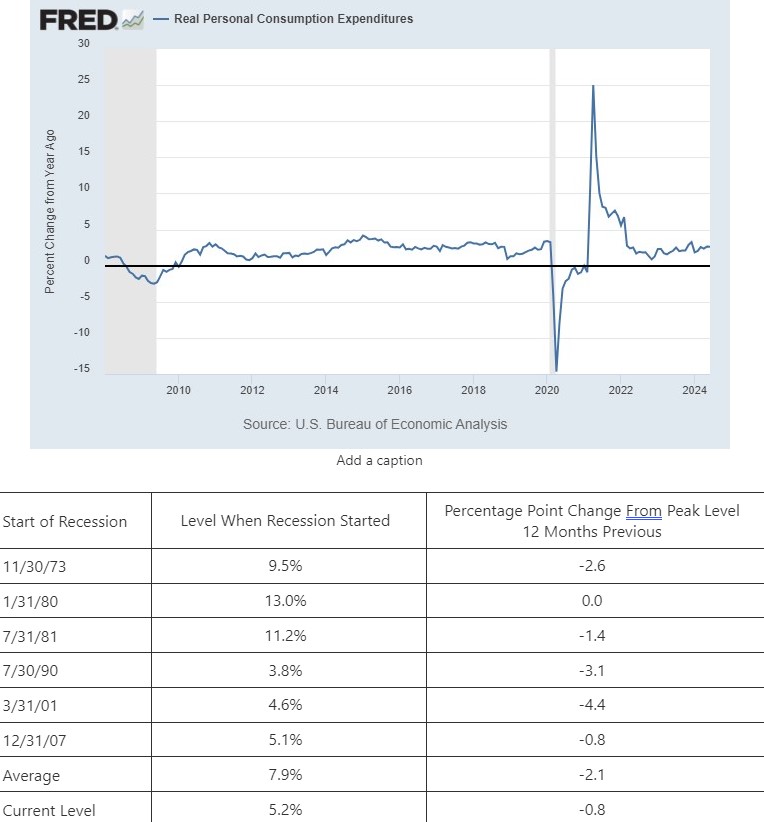
- Real Personal Consumption Expenditures (i.e. Spending)
- Measures of Economic Growth
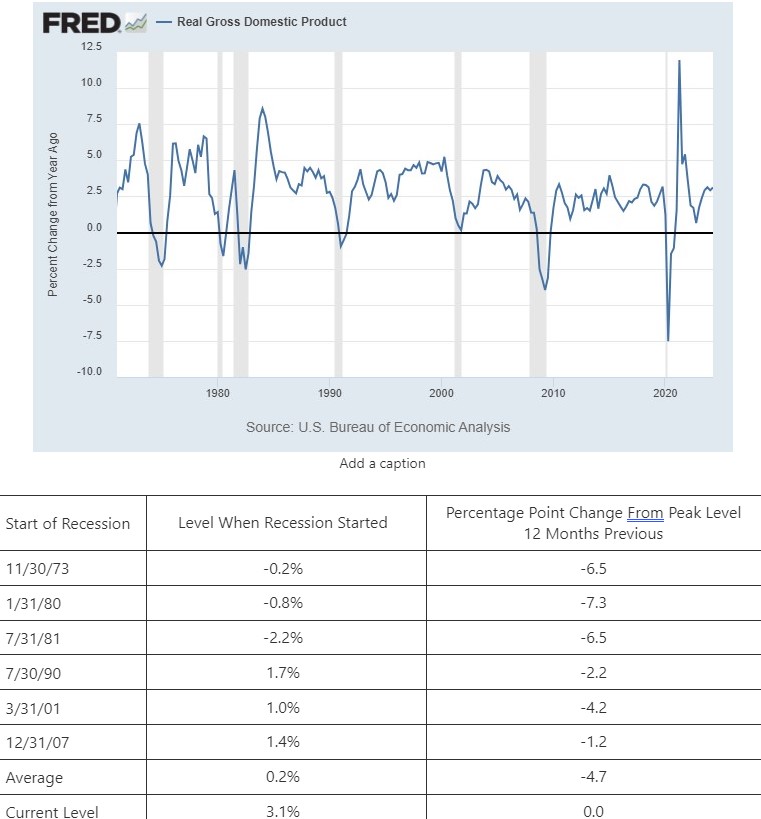
- Real Gross Domestic Product
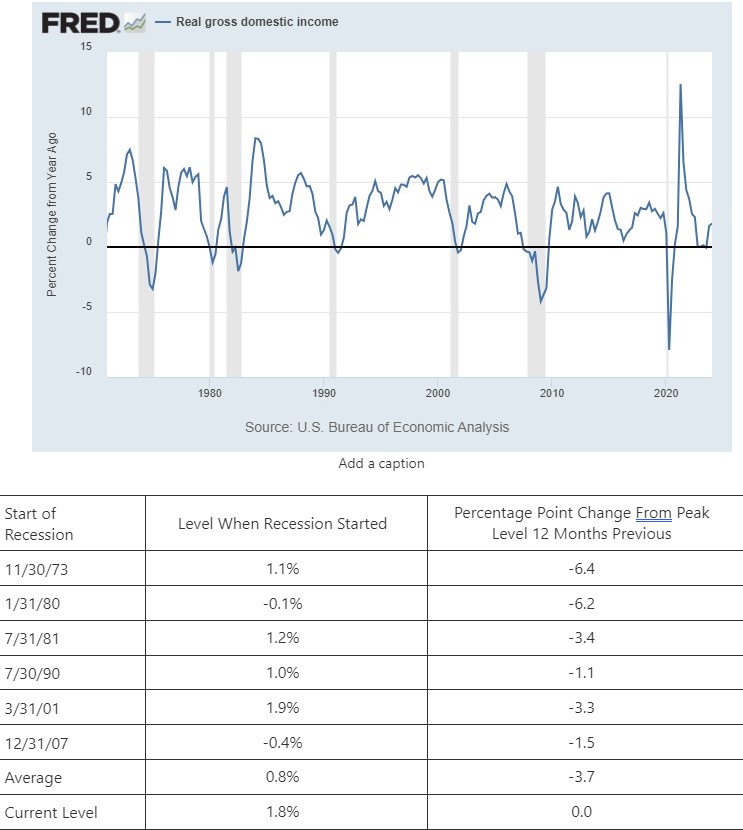
- Real Growth Domestic Income
- In order to give an “apples to apples” comparison, I am using year-over-year growth rates.
- The official growth rates for the two measures of economic growth are annualized quarterly numbers while the six economic data series are actual growth rates.
- In order to compare all indicators with the same measure, I am showing the year-over-year growth rates for all indicators.
- Unfortunately, the data for Real Personal Consumption Expenditures (Inflation adjusted) only goes back to 2008. In order to give a comparable comparison for historical recessions, I am using Personal Consumption Expenditure data (not inflation adjusted). This will at least give us the ability to see levels that existed for past recessions.
Summary
- Contrary to what may be portrayed by some, the data the NBER tracks does not show the sky is falling or that the US is currently in a recession.
- That does not mean that the data shows everything is rosy as it relates to the economy.
- The data show the economy is growing but there are signs of “cracks in the foundation” that need to be monitored closely.
- Believe what you are experiencing not what you are hearing, if the two do not match.
Observations
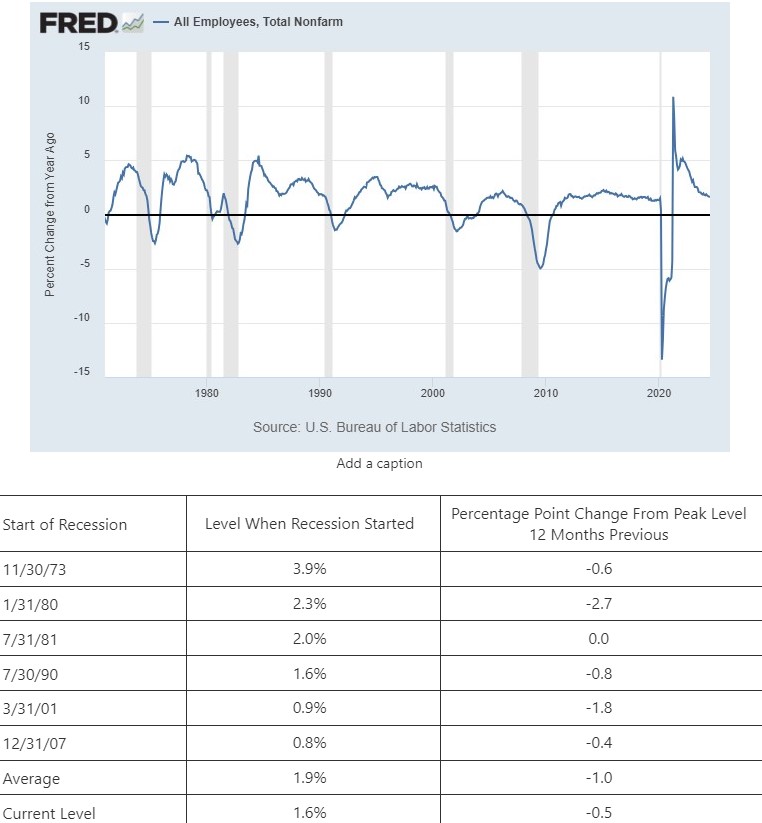
- Growth in nonfarm payrolls is below the average and below the growth rate that existed at the start of three out of the past six recessions.
- The change from the peak level over the past 12 months is below the average and below the level that existed at the start of five out of the last six recessions.
- Given the mixed signals between the year-over-year growth and the change from the 12-month peak, this data series is giving a “yellow” signal.
Employment
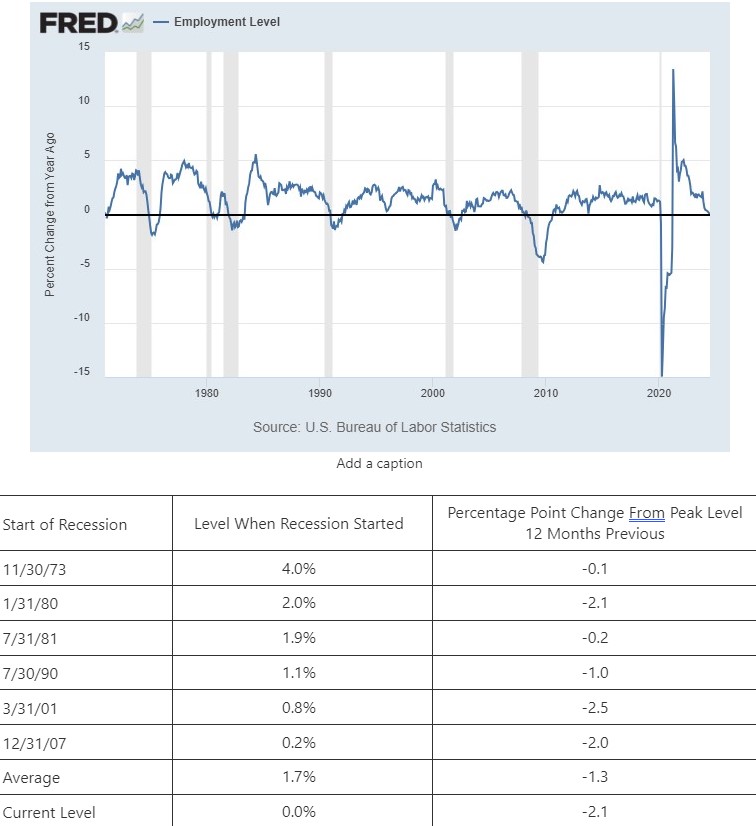
- The year-over-year growth rate for employment is below levels that existed for the past six recessions and below the average.
- The percentage point change from the 12-month peak is more than the average and is greater or equal to the levels that existed at the start of five out of the last six recessions.
- The employment data series is flashing a “red” warning signal.
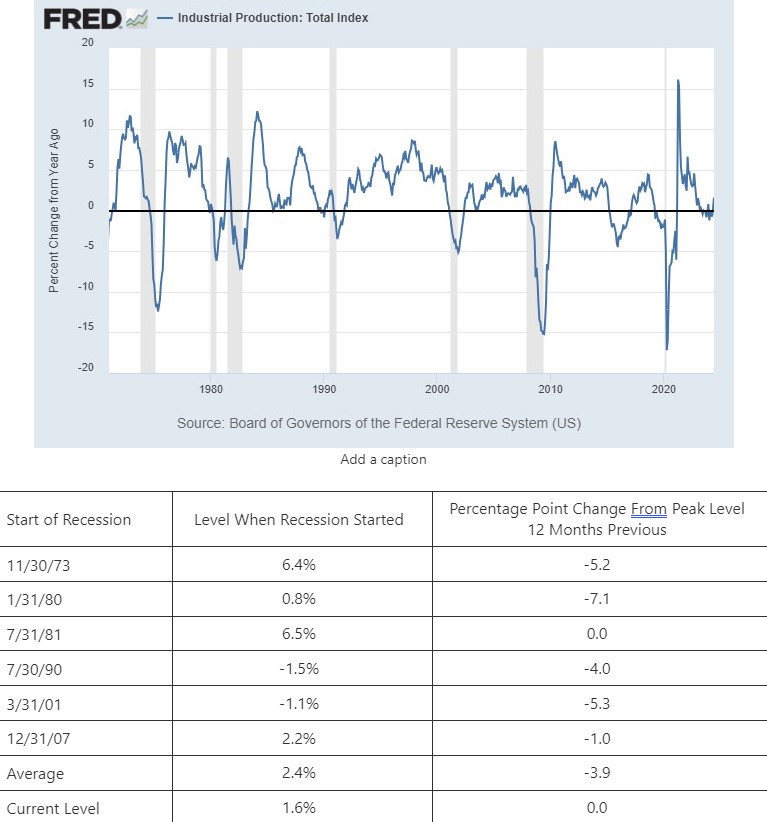
- The current growth rate is below the average and below three out of the past six growth rates that existed at the start of the recessions. Looking at the graph, the trend for this data series is beginning to rise.
- The change from the 12-month peak is below the average and below the level that existed for five out of the six recessions.
- Given the mixed signals between the current growth rate and the change from the 12-month peak, the data series is flashing a “yellow” signal.
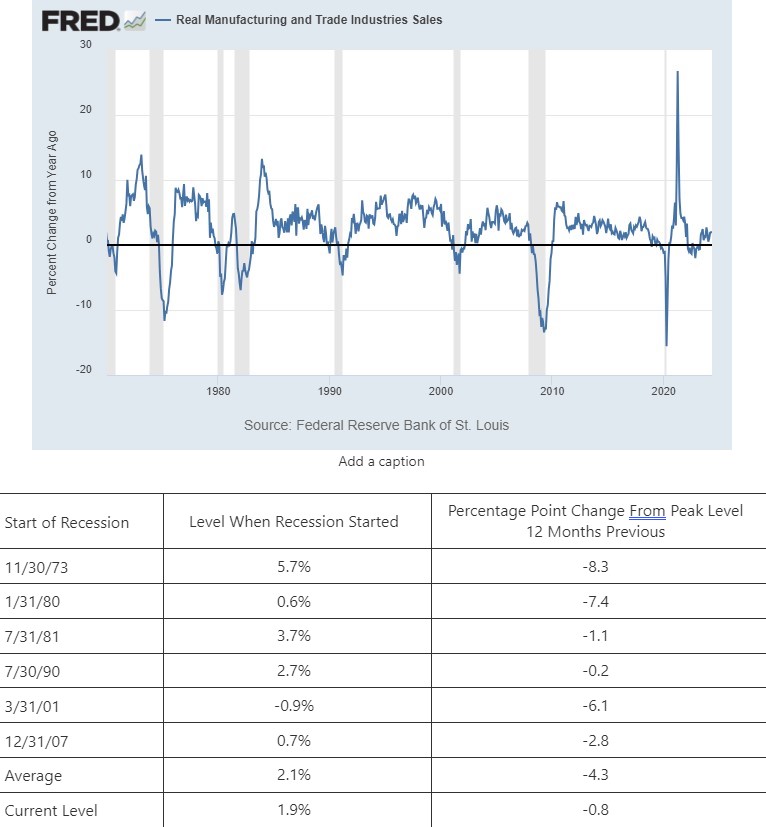
- This data series is a month behind the others so, caution is needed in the fact that we do not having a common time series.
- The current level is slightly below the average when examining the current level and is higher than three out of the last six recessions.
- The change from the 12-month peak is well below the average and below levels that existed for five out of the last six recession.
- This data series is flashing a “yellow” signal at this time.
- This data series is below the average and below the level that existed at the start of four out of the past six recessions.
- The change for the 12-month peak is below the average and below the level that existed at the start of four out of the past six recessions.
- Given the mixed signals, data series as giving a “yellow” warning signal.
- Personal spending is below the average for the start of the past six recessions.
- It is worth noting that there has been a clear shift in the growth level that existed for the start of the past three recessions versus the previous three recessions.
- The average growth rate that existed at the start of the past three recession is 4.5% and the change from the 12-month peak is -2.8 percentage points.
- I would classify this data series as flashing a “yellow” signal if you look at all six past recessions but a “green” if you believe that a change has occurred with spending and that the past three recessions is a more recent way to measure.
- Real Gross Domestic Income is above its average and above all levels that existed at the start of the past six recessions except for the March 2001 recession.
- The change from the 12-month peak is above the average and well above levels that existed at the start of the past six recessions.
- Real Gross Domestic Income is not signaling a recession.
- Real Gross Domestic Product is well above the average and is also significantly above levels that existed at the start of the past six recessions
- The change from the 12-month peak level is also well above the average and the levels that existed at the start of the past six recessions.
- Real Gross Domestic Product is not signaling a recession.
Closing Thoughts
- The official data used to determine if a recession has started is mixed.
- Two are giving the “all clear” signal
- Five are flashing “yellow” warning signals.
- One is flashing a “red” warning signal.
- Based on the data, the economy is not currently in a recession.
- I will again caution that because the economy as a whole is not in recession, it does not mean that all individuals and businesses are not experiencing recessionary conditions.
- We know from the information that was examined over the past six newsletters that many individuals are experiencing some level of difficulty paying their regular expenses and that the trend is rising.
- The fact that five out of the seven data series are flashing a “yellow” signal also indicates that the economy some level of difficulty.
- My biggest caution is that one month's worth of data (i.e. a weaker than expected result for jobs growth) does not establish a trend and is not sufficient, on its own, to cause the Federal Reserve to immediately lower interest rates.
- Of course, that does not mean that financial market participants, or the media will stop having exaggerated responses to monthly data!
- What gets lost in a lot of the media coverage is that all of the traditionally reliable recession indicators have failed in this economic cycle. As a result, the fact that another indicator is now flashing a recession warning should be treated with caution as it may turn out that it has also failed.
- I believe that this is because this economic cycle has broken the mold of previous economic cycles.
- We have never jump-started an economic cycle with over $5 trillion of fiscal stimulus. As a result, econometric models that are used to forecast the economy have essentially failed because they rely on regression analysis of past cycles.
- I am not advocating that we ignore the indicators. I am simply saying we cannot treat them as guaranteed signals. As a whole, all of the indicators that are flashing warnings should be viewed as just that: warnings, not guarantees.
-
I continue to advocate that you believe what you or your company are experiencing and ignore what you are hearing if the two do not match. You will see the changes (positive or negative) far faster by paying attention to what you are experiencing.
Economic Data
|
Data |
Time Period Being Reported |
Current |
Previous |
Comments |
|
8/5/24 |
|
|
|
|
|
S&P Global PMI |
July |
54.3 |
54.8 |
Activity continued to slow bu, is still growing. |
|
July |
55.0 |
55.3 |
Service sector activity also slowed. |
|
8/6/24 |
|
|
|
|
|
Trade Balance |
June |
-$73.1 billion |
-$75.0 billion |
Exports grew more than imports to shrink the deficit. |
|
8/7/24 |
|
|
|
|
|
MBA Mortgage Applications |
8/2/24 |
+6.9% |
-3.9% |
A decline in mortgage rates helped snap the string of declines |
|
8/2/24 |
+0.8% |
-4.0% |
Purchase activity barely increased as high home prices are still a barrier to purchases. |
|
8/2/234 |
+15.9% |
+0.2% |
The drop in mortgage rates triggered a wave of refinancing activity. |
|
8/8/24 |
|
|
|
|
|
Initial Jobless Claims |
8/3/24 |
233,000 |
250,000 |
Initial claims fell by 17,000 |
|
Continuing Jobless Claims |
7/27/24 |
1,875,000 |
1,869,000 |
Continuing claims rose 6,000 |
|
Wholesale Sales Monthly Change |
June |
-0.6% |
+0.3% |
Sales fell into negative territory. |
|
Wholesale Inventories Monthly Change |
June |
+0.2% |
+0.2% |
The increase in inventories may have been involuntary as a result of the decline in sales. |

Steve is the Economist for Washington Trust Bank and holds a Chartered Financial Analyst® designation with over 40 years of economic and financial markets experience.
Throughout the Pacific Northwest, Steve is a well-known speaker on the economic conditions and the world financial markets. He also actively participates on committees within the bank to help design strategies and policies related to bank-owned investments.


