Perspectives
Last Friday, Federal Reserve Chairman Powell gave a speech and indicated that the time had come to begin lowering interest rates. He cited weakness in the labor markets as the reason to do this. For over two years the Federal Reserve's sole focus was taming inflation. It appears that it now feels that the focus should be on jobs. Today's Perspectives examines jobs and wages.
I am adopting a new format for the Perspective section. Based on conversations and feedback, I have been reminded that different viewers have different preferences. Some desire a short “Two Minute Sound Bite”, others prefer a “Short Book” with a few details, while other like a full-blown “Novel” with all of the details, tables and graphs. As a result, starting today:
- If you just want a quick summary, read the Two Minute Sound Bite section.
- If you want a little more detail: continue on and read the Summary section.
- If you want all of the graphs, tables and commentary: continue reading through the end of the Closing Thoughts section.
Two Minute Sound Bite
The slower-than-expected jobs growth in July caught the Federal Reserve's attention and the downward revision of 810,000 fewer jobs than originally reported between April 2023 and March 2024 appears to have spooked the Federal Reserve.
Even though jobs are growing, the pace is clearly slowing. An area of concern is that, over the past ten years, jobs growth has been highly concentrated in three to four sectors and has become even more concentrated over the past twelve months. For the past year, the top three industry sectors (Education & Healthcare, Government and Leisure & Hospitality) accounted for 75% of total jobs growth. The problem is those industries are not the leaders from a wage perspective. From a wage perspective, those top three industries for jobs growth only accounted for 33% of wage growth. If we want to monitor for potential changes in consumer spending, we should watch for changes in jobs growth for the top three industries for wages.
Next Friday's jobs report will be the key deciding factor for the Federal Reserve's interest rate decision in September. Inflation remains stubbornly around the 2.6% level, so a weak jobs report is needed to justify an interest rate reduction.
Summary
- Jobs are still growing but slowing.
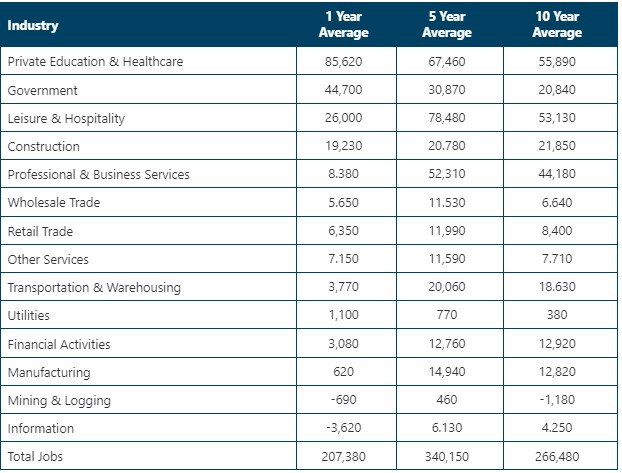
- Average monthly jobs growth over the past year was 207,380 compared to the five-year average of 340,150 and the ten-year average of 266,480 (Note: the 6-month distortion during the pandemic crisis has been excluded from the calculation to give a fair comparison of the one-year average (no pandemic effect) to the five- and ten-year averages).
- Jobs growth has been highly concentrated in three industries.
- 75% of total jobs growth as of July 2024
- 81% of total private sector jobs (excluding government) as of July 2024.
- The surge in concentration that occurred July 2024 compared to July 2019 and July 2014 is noteworthy. It will be important to see if August's result continues this level of concentration or if it was a one-time aberration.
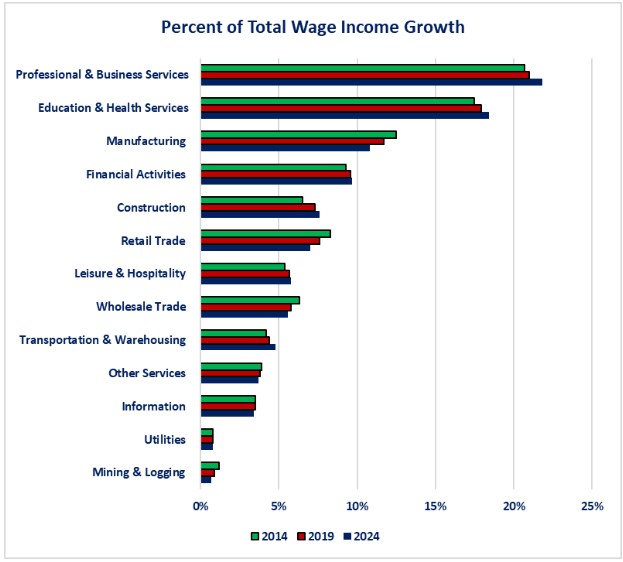
- Unfortunately, the top three sectors for private sector jobs growth as of July 2024 (Education & Healthcare, Leisure & Hospitality and Construction) only accounted for 33% of wage growth.
- Now that the Federal Reserve has communicated that it is concerned about and is focused on jobs growth, next Friday's jobs report will be a major focus for the Federal Reserve, economists, news media and financial markets.
- The Federal Reserve's next policy meeting is September 17-28.
Observations
- The data comes from the Bureau of Labor Statistics (BLS)
- The data is as of 7/31/24
- The BLS defines three major categories and 14 major industry sectors
- Goods Producing Jobs
- Construction
- Manufacturing
- Mining & Logging
- Service Providing Jobs
- Education & Health Services
- Financial Activities
- Information
- Leisure & Hospitality
- Other Services
- Professional & Business Services
- Retail Trade
- Transportation & Warehousing
- Wholesale Trade
- Utilities
- Government
Total Jobs Growth
In order to get a more realistic picture, I have excluded the distortion in jobs growth due to the pandemic crisis. This means that I have excluded data from March 2020 through September 2020 due to the huge swings in the numbers. By October 2020, those distortion had dissipated.
- The monthly average for total jobs growth has slowed significantly compared to the five-year average but not as dramatically compared to the ten-year average.
- Private Education & Healthcare and Government jobs are the only two sectors where the average has consistently increased over the past ten years.

Industry Sectors as a Percent of Total Jobs Growth
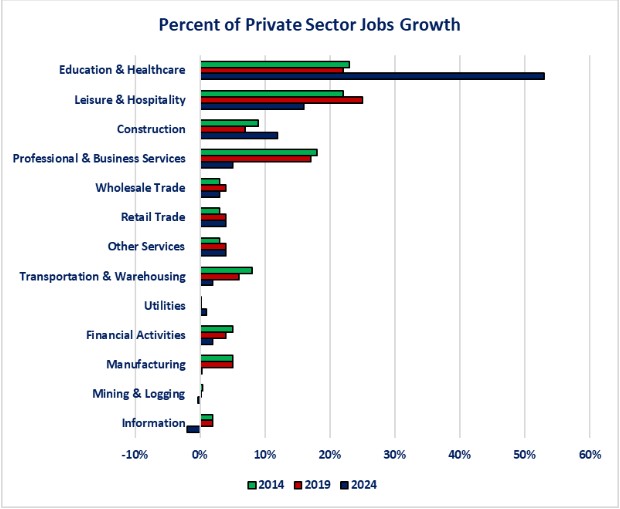
- Education & Healthcare, Leisure & Hospitality and Professional & Business Services were the top three sectors as of July 2014 and July 2019. Government leap-frogged Professional & Business Services in July 2024.
- The top three industries made up 58% of total jobs growth as of July 2014, 58% as of July 2019 and 75% as of July 2024.
Since the BLS does not provide average weekly earnings details for Government jobs, I am showing the same graph as above but as a percent of total Private jobs. This will allow comparison to wage details.
-
The concentration of jobs growth is even bigger when examining private sector jobs growth.
-
The top three industries (Education & Healthcare, Leisure & Hospitality, Construction) accounted for 81% of total jobs growth as of July 2024. The top three (Education & Healthcare, Leisure & Hospitality, Professional & Business Services) accounted for 61% as of July 2019 and 63% as of July 2014.

Industry Sectors as a Percent of Total Wage Growth
-
The top three industries for jobs growth as of July 2024 may have accounted for 81% of private sector jobs growth but they only accounted for 33% of total wage growth.

Closing Thoughts
- The data highlights how concentrated jobs growth has been over the last ten years.
- It is noteworthy how much more concentrated the results were for July 2024.
-
This raises the question as to whether there were distortions that were not fully adjusted for with the seasonal adjustment factors that are used.
-
It will be interesting to see if this was a one -time distortion that corrects itself with the August data that will be released next week.
-
The financial markets (and the Federal Reserve?) are clearly not prepared for the possibility that July's numbers were an aberration if that proves to be the case!
-
-
One of the problems with the concentration in jobs growth-especially as of July 2024-is that it is lower paying jobs that are seeing the most growth.
-
Education & Healthcare ranks 10 out of 13 for average weekly earnings as of July 2024.
-
Leisure & Hospitality ranks 13 out of 13.
-
Construction ranks 8 out of 13.
-
Utilities ranks #1 but only contributed 1% to total jobs growth.
-
Information ranks #2 and lost jobs.
-
Mining & Logging ranks #3 and lost jobs.
-
-
The Federal Reserve has two mandates in its charter.
-
Full employment
-
Stable inflation
-
-
For over two years the Federal Reserve has focused solely on inflation because it was well above its 2% target and jobs growth was strong.
-
With the weak jobs report for July and the major downward revision to April 2023 through March 2024 data, the focus has now shifted.
-
The most July minutes from the Federal Reserve reflected the fact that it is now focusing on both the health of jobs growth as well as inflation
-
The speech given by Chairman Powell last Friday indicates that the Federal Reserve may now have moved to focusing more heavily on jobs growth. As a result, next Friday's jobs report has gained far more importance than previous reports.
-
-
We will gain a better understanding as to whether the Federal Reserve is solely focused on jobs if the jobs report is weak and the Federal Reserve cuts interest rates.
-
The inflation data has remained stubbornly around the 2.6% level so if the Federal Reserve was still solely focused on inflation, an interest rate cut would be questionable.
-
If a rate reduction occurs at the September policy committee meeting, it will show that the Federal Reserve has now shifted its focus to jobs.
-
Economic Data
|
Data |
Time Period Being Reported |
Current |
Previous |
Comments |
|
8/26/24 |
|
|
|
|
|
Durable Goods Orders Monthly Change |
July |
+9.9% |
-6.9% |
The surge was all due to a surge in Transportation orders. |
|
Core Durable Goods Orders Monthly Change |
July |
-0.2% |
+0.1% |
Orders fell once the Transportation sector was factored out. |
|
8/27/28 |
|
|
|
|
|
FHFA Home Price Index Year-Over-Year Change |
June |
+5.1% |
+5.9% |
Home prices continue to grow but at a slightly slower pace. |
|
S&P Case Schiller Home Price Index |
June |
+6.5% |
+6.9% |
Same trend as the FHFA index. |
|
Consumer Confidence |
August |
103.3 |
101.9 |
Lower interest rates and rising financial markets helped boost confidence. |
|
Richmond Federal Reserve Manufacturing Activity Index |
August |
-19 |
-17 |
Activity fell further in August. |
|
Richmond Federal Reserve Service Sector Activity Index |
August |
-11 |
+5 |
Activity in the service sector fell into contraction. |
|
Dallas Federal Reserve Service Sector Activity Index |
August |
8.7 |
7.7 |
Activity improved slightly. |
|
8/28/24 |
|
|
|
|
|
MBA Mortgage Applications Weekly Change |
8/23/24 |
+0.5% |
-10.1% |
Activity picked up slightly as mortgage rates remained stable. |
|
8/23/24 |
+1.0% |
-5.0% |
Buyer activity continues to remain muted as home prices have not come down. |
|
8/23/24 |
-0.1% |
-15.0% |
With little movement in rates, activity was basically unchanged. |
|
8/29/24 |
|
|
|
|
|
Initial Jobless Claims Weekly Change |
8/24/24 |
231,000 |
236,250 |
Initial claims fell 5.250. |
|
Continuing Jobless Claims Weekly Change |
8/17/23 |
1,868,000 |
1,855,000 |
Continuing claims rose by 13,000. |
|
Real Gross Domestic Product-First Revision |
2nd Quarter |
3.0% |
1.4% |
2nd quarter was revised from the original estimate of 2.8% to 3.0%. An upward revision in consumer spending was the primary reason for the upward revision. |
|
Pending Home Sales Monthly Change |
July |
-5.5% |
+4.8% |
Buyers continue to be resistant to the high prices for homes. |
|
8/30/24 |
|
|
|
|
|
PCE Price Index Monthly Change |
July |
+0.2% |
+0.1% |
This is not the direction that the Federal Reserve desires. |
|
PCE Price Index Year-Over-Year Change |
July |
+2.5% |
+2.5% |
No progress from last month. |
|
Core PCE Price Index Monthly Change |
July |
+0.2% |
+0.2% |
Once again, this is not the results the Federal Reserve desires. |
|
Core PCE Price Index Year-Over-Year Change |
July |
+2.6% |
+2.6% |
No progress from the core number either. |
|
Personal Income Monthly Change |
July |
+0.3% |
+0.2% |
Consumers experienced an increase in their personal income. |
|
Personal Income Year-Over-Year Change |
Jully |
+4.5% |
+4.4% |
Same results for the year-over-year number. |
|
Real Disposable Personal Spending Monthly Change |
July |
+0.1% |
+0.1% |
After inflation and taxes, personal income barely rose. |
|
Real Disposable Personal Spending Year-Over-Year Change |
July |
+1.1% |
+1.0% |
After income and taxes, the year-over-year increase was far smaller than the headline number. |
|
Personal Spending Monthly Change |
July |
+0.5% |
+0.3% |
Consumers ramped up their spending in July. |
|
Personal Spending Year-Over-Year Change |
July |
+5.3% |
+5.4% |
On a year-over-year basis, spending slowed slightly. |
|
Real Personal Spending Monthly Change |
July |
+0.4% |
+0.2% |
Consumers continue to spend at a faster pace than their growth in income. |
|
Real Personal Spending Year-Over-Year Change |
July |
+2.7% |
+2.8% |
Same story for spending after inflation. Real spending is growing at more than double the pace of real income growth. |
|
University of Michigan Consumer Sentiment Index |
August |
67.9 |
66.4 |
The increase was solely due to an increase in consumers outlook for the future. |
|
August |
61.8 |
62.7 |
Consumers continue to become less confident in their current conditions. |
|
August |
72.1 |
68.8 |
Even though they are gloomy about their current conditions, they are optimistic about the future. |

Steve is the Economist for Washington Trust Bank and holds a Chartered Financial Analyst® designation with over 40 years of economic and financial markets experience.
Throughout the Pacific Northwest, Steve is a well-known speaker on the economic conditions and the world financial markets. He also actively participates on committees within the bank to help design strategies and policies related to bank-owned investments.


