


Perspectives
-
Building Materials & Gardening Supplies
-
Clothing & Accessories
-
Electronics & Appliances
-
Food & Beverage Stores
-
Food Services & Drinking Establishments
-
Furniture & Home Furnishings
-
Gasoline Stores
-
General Merchandise Stores
-
Health & Personal Care
-
Miscellaneous Retailers
-
Motor Vehicles & Parts
-
Nonstore Retailers
-
Sporting Goods, Hobby, Music & Books
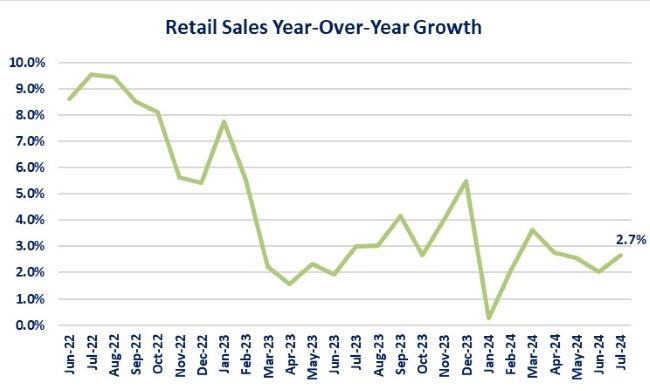
I will start by showing the year-over-year growth of retail sales and then examine what items consumers were buying and illustrating any changes in trend from historical buying patterns.
Summary
-
Retail sales do not show a pattern of the consumer beginning to make any dramatic cutbacks on discretionary spending.
-
Before we celebrate too much, the increase in retail sales may be due to increases in the price of products rather than an increase in the volume of products being purchased.
-
That implies the consumer is not necessarily willingly buying more, rather it may be that they are being forced to pay more for the same quantity that they have purchased in the past.
-
-
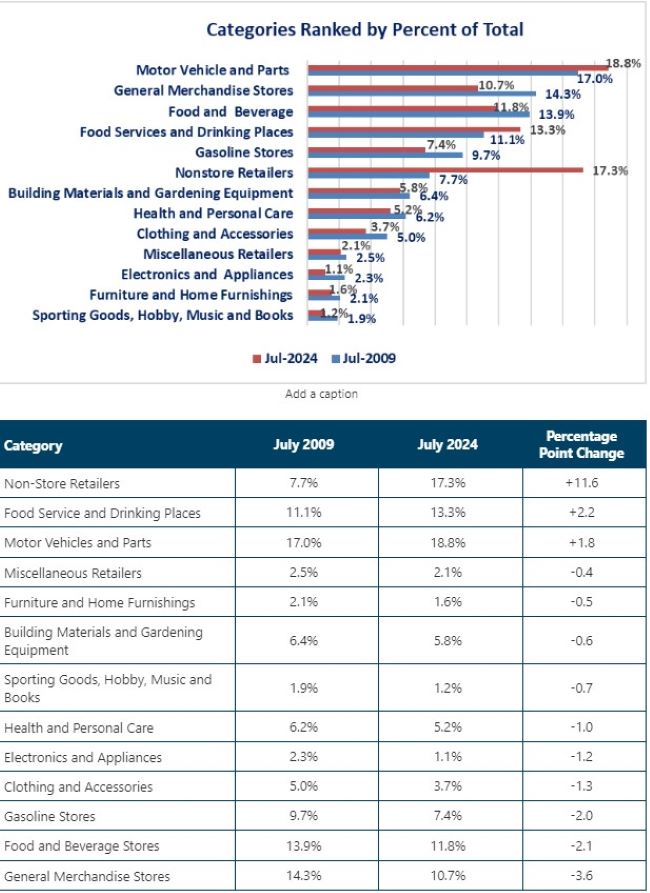
Three categories experienced an increase in their contribution to total retail sales.
-
This was at the expense of the other ten categories.
-
-
Nonstore Retailers (i.e., E-Commerce) experienced the biggest percentage point increase from July 2009.
-
General Merchandise Stores (including Department Stores) experienced the biggest percentage point decline.
-
Overall, the data confirms what has been reported on a regular basis: consumers are shifting more of their discretionary purchases to online purchases from “brick and mortar" retailers.
Observations
-
After experiencing steady declines from March through June of this year, retail sales rebounded in July.
-
That is inconsistent with the narrative of an imminent recession that was being pushed after the weak jobs report two weeks ago.
-
-
The change in buying patterns from “brick and mortar” stores to online stores is clear given the huge percentage increase for non-store retailers since 2009.
-
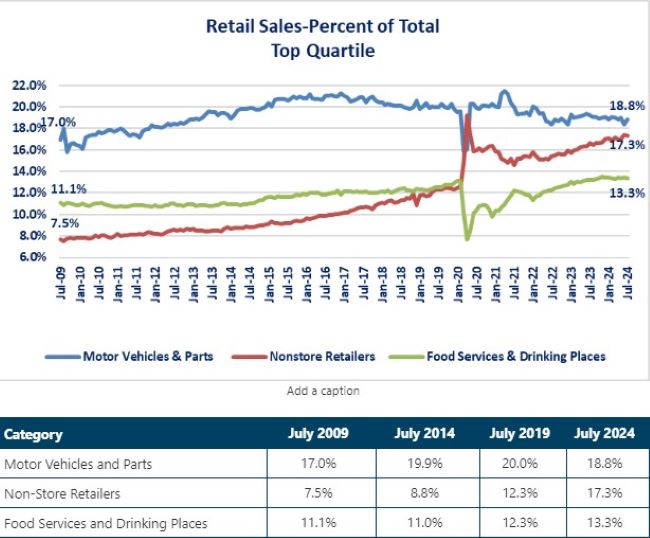
The increase in the Motor Vehicles and Parts category appears to be more related to strong price increases that have occurred since July 2009 versus a strong increase in the number of vehicles and parts sold.
- Even though the Motor Vehicles & Parts category makes up the largest percent of total retail sales the trend is not rising for this category.
-
The percentage is higher than July 2009, but lower than both 2014 and 2019.
-
-
Nonstore Retailers and Food Service & Drinking Places show clear rising trends.
-
Both Motor Vehicles & Parts and Food Services & Drinking Places experienced a big drop when the COVID lockdown occurred but only Food Services & Drinking Places have risen above the previous high in 2019.
-
-
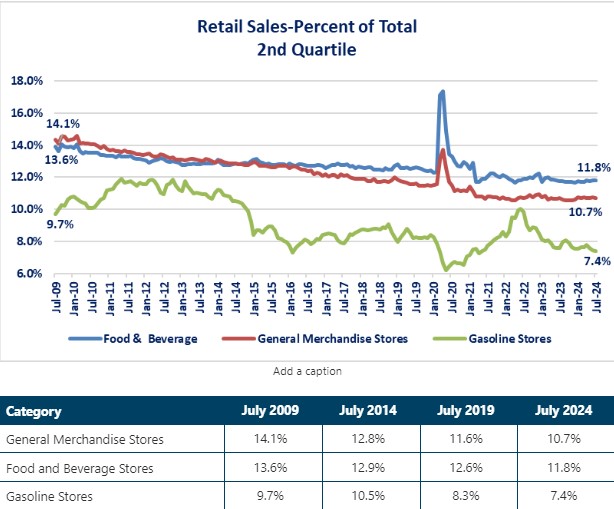
Consumers clearly ramped up their purchases at grocery stores-to the point of hoarding for some items-during the COVID pandemic, but the percent of total retail sales for the Food & Beverage category has steadily declined since then and is below 2009 levels.
-
All three categories in the 2nd quartile now make up a smaller percentage of total retail sales compared to 2009.
-
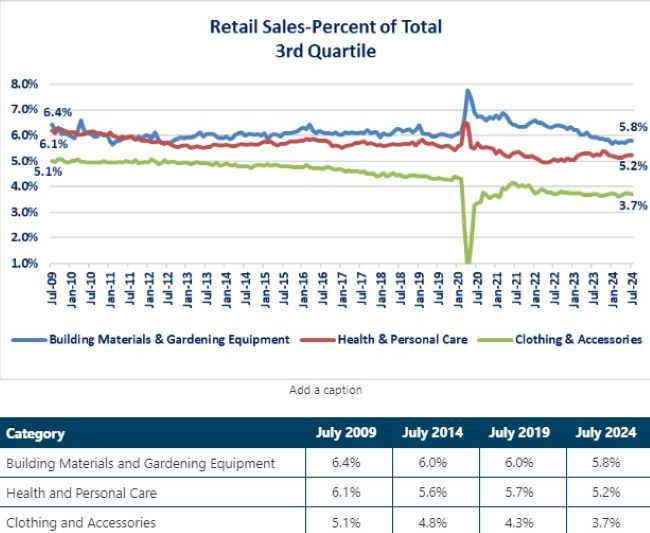
Two categories-Building Materials & Gardening Equipment and Health & Personal Care-benefited from an increase in consumer spending during the COVID pandemic but have trended lower since then.
-
All three categories in the 3rd quartile now make up a lower percentage of total retail sales compared to 2009.
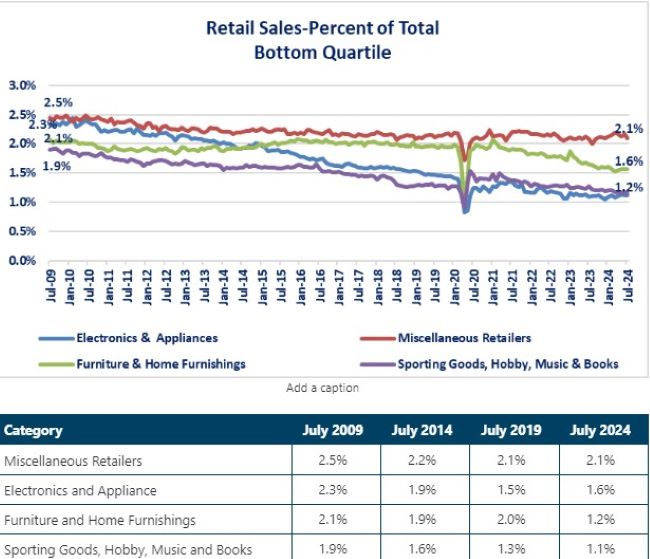
- There is a clear downtrend for three out of the four bottom quartile categories.
-
Electronics & Appliances
-
Furniture & Furnishings
-
Sporting Goods, Hobby, Music & Books
-
-
All three categories make up a smaller percentage of total retail sales compared to 2009.
Closing Thoughts
-
What the data tells us is that consumer spending on retail sales grew by 2.7% year-over-year, which was stronger than June's results.
-
What the data does not tell us is whether the consumer is buying more goods or just paying more for the same quantity of goods (or less) compared to a year ago.
-
That matters from an economic perspective because if consumers are simply paying more for the same quantity as last year, then businesses have no need to create more jobs. If consumers are buying more items, then demand for the products increased and may stimulate businesses to add more jobs to keep up with demand.
-
-
There are difficulties in drawing clear conclusions from the Retails Sales data due to the Census Bureau's classification process. The biggest challenge is the fact that the Census Bureau lumps all nonstore retailers into one category while it breaks out the “brick and mortar” retailer categories.
-
What may look like a substantial change for a “brick and mortar” category may be a shift to buying the same product online.
-
Because of the way all online sales are lumped into one category, most of the data only helps us understand where consumers are buying their products but not what they are buying.
-
Only “brick and mortar” categories that cannot be offered online allow for understanding both the “what” and “where” question.
-
The Food Services & Drinking Places and Gas Station categories are the two prime examples.
-
-
-
-
The other challenge in analyzing the Census Bureau data is that they do not provide Real Retail Sales data (inflation adjusted).
-
Real Retail Sales was reported up until 2001. It was discontinued when the industry classification method was changed from the Standard Industry Classification system (SIC) to the North American Industry Classification System (NAICS).
-
-
There are two clear takeaways from the Retail Sales data.
-
The consumer is making more of their discretionary purchases via nonstore retailers (i.e. online) and it has increased consistently over the past 15 years.
-
The consumer is spending more on retail sales than a year ago.
-
-
What is not clear from the data is whether the consumer is paying more but not necessarily buying more.
-
Another way of saying that is that it is not clear whether the consumer may be spending more because they must (prices have risen) or because they want to (buying more items)
-
Economic Data
|
Data |
Time Period Being Reported |
Current |
Previous |
Comments |
|
8/19/24 |
|
|
|
|
|
Leading Index Monthly Change |
July |
-0.6% |
-0.2% |
The index continues to point to slowing growth. |
|
8/21/24 |
|
|
|
|
|
MBA Mortgage Applications Weekly Change |
8/16/24 |
-10.1% |
+16.8% |
After two weeks of strong increases, last week took a bit of a breather as mortgage rates did not experience further big declines. |
|
8/16/24 |
-5.0% |
+3.0% |
Purchase activity also pulled back after two weeks of solid gains. |
|
8/16/24 |
-15.0% |
+20.2% |
The surge in refinancing activity over the past two weeks was at a pace that could not be maintained. |
|
8/22/24 |
|
|
|
|
|
Chicago Federal Reserve National Activity Index |
July |
-.34 |
-.09 |
This index indicates that the economy slowed more in July than in June. |
|
Initial Jobless Claims Weekly Change |
8/17/24 |
232,000 |
228,000 |
Initial claims rose 4,000 last week but, remain within a range. |
|
Continued Jobless Claims Weekly Change |
8/10/24 |
1,863,000 |
1,859,000 |
Continued claims rose 4,000 but the rise was entirely due to a 4,000 downward revision of last week's data. |
|
S&P Global PMI |
August |
54.1 |
54.3 |
Overall activity slowed slightly. |
|
August |
48.0 |
49.6 |
Manufacturing activity fell further into contraction. |
|
August |
55.2 |
55.0 |
Service activity remains positive and improved slightly. |
|
Existing Home Sales Monthly Change |
July |
+1.3% |
-5.1% |
Existing home sales moved back into slightly positive territory. |
|
8/23/24 |
|
|
|
|
|
New Home Sales Monthly Change |
July |
|
-0.6% |
The western region of the US drove the increase as sales were up 33.8% in the West. |

Steve is the Economist for Washington Trust Bank and holds a Chartered Financial Analyst® designation with over 40 years of economic and financial markets experience.
Throughout the Pacific Northwest, Steve is a well-known speaker on the economic conditions and the world financial markets. He also actively participates on committees within the bank to help design strategies and policies related to bank-owned investments.