


Perspectives
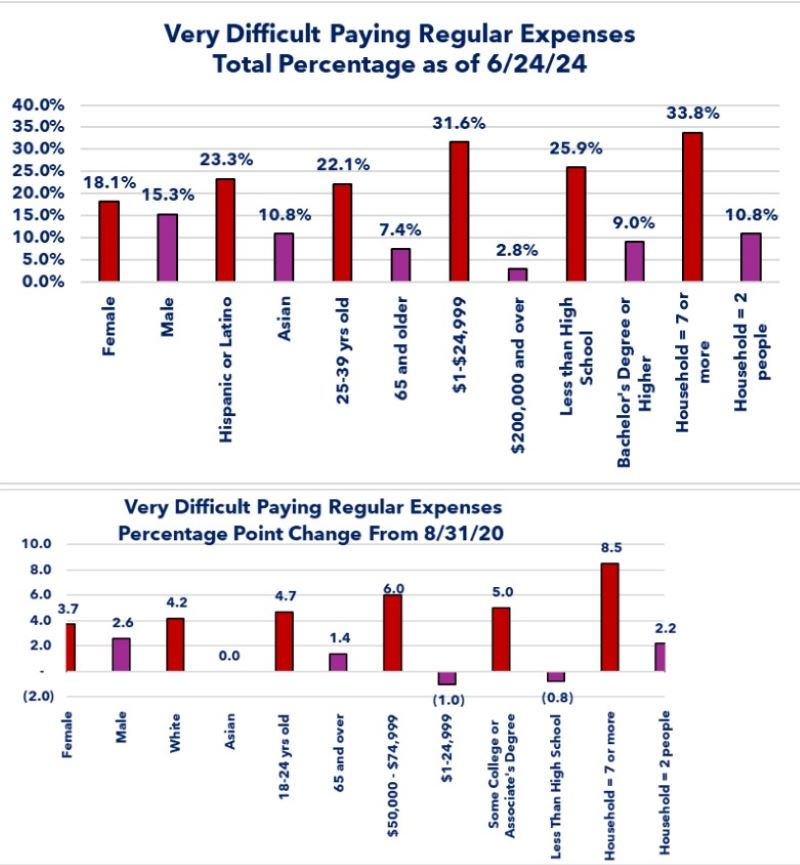
- Very Difficult
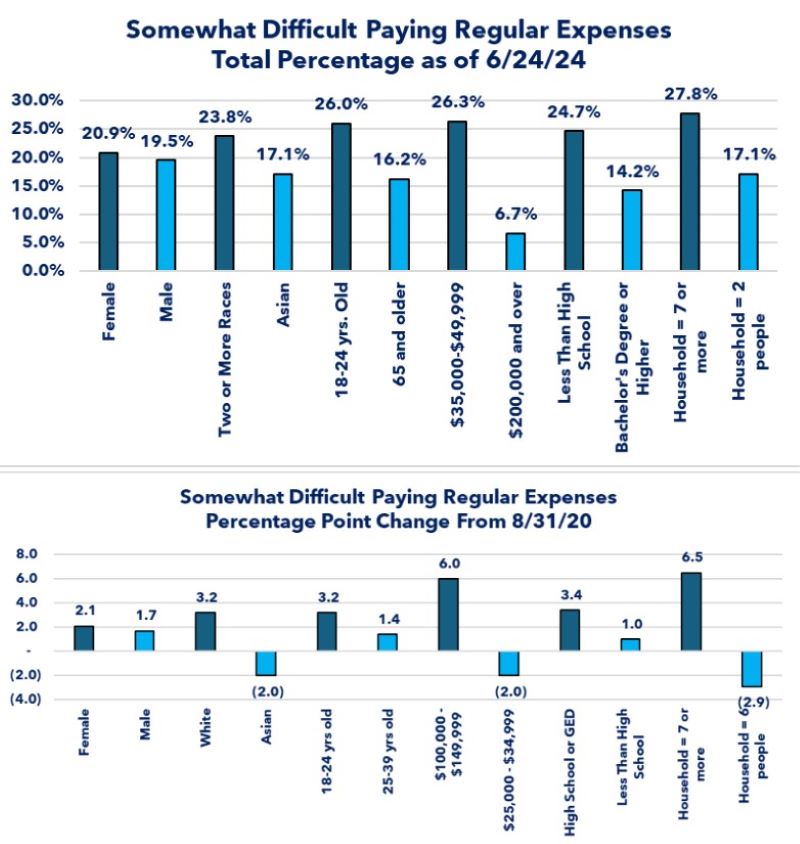
- Somewhat Difficult
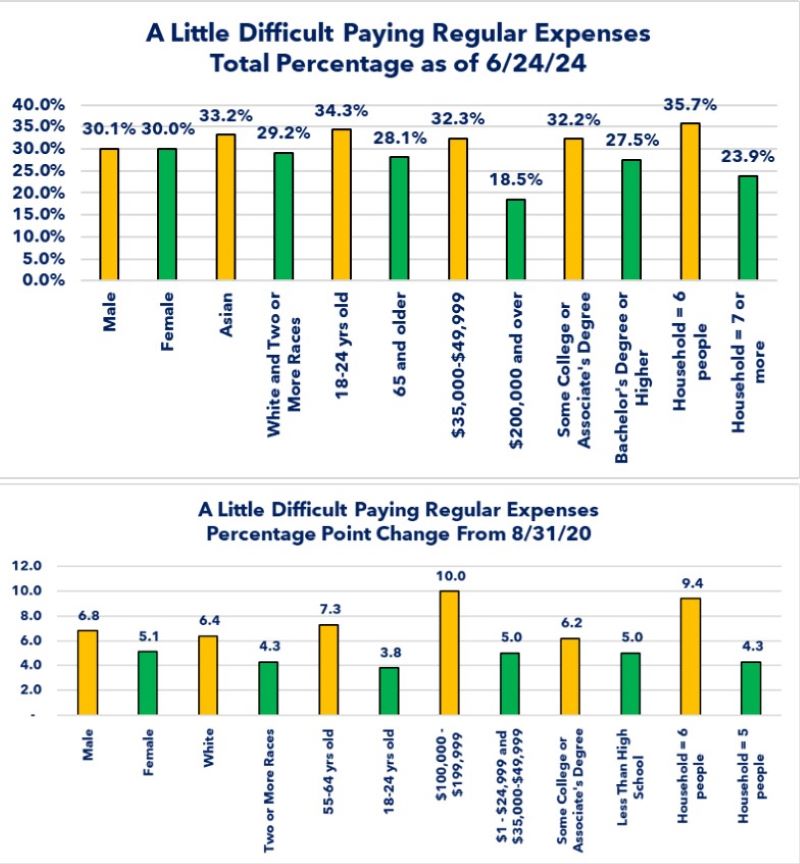
- A Little Difficult
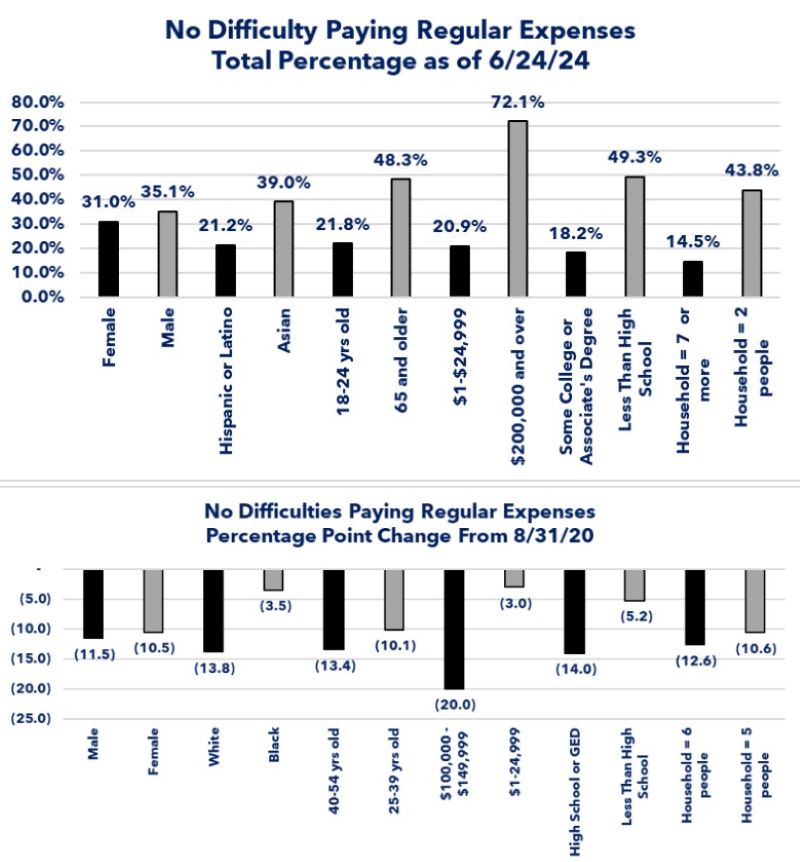
- No Difficulty
- There will be two graphs for each level of difficulty.
- The first graph will show the who has the highest and lowest percentage for each of the difficulty categories.
- The second graph shows who has experienced the biggest and smallest increase in the given difficulty category since 8/31/20.
- Since these graphs are “point in time” graphs versus the time series used during the five weeks, the graphs are less packed with data.
As a result, I was able to add the data points on the graph and eliminate the tables. - Since I provided commentary on each of the individual categories during the week I covered that “lens”, there will be no commentary on the graphs except in the Summary and Closing Thoughts sections.
- I added in a “lens” for gender (male or female) for the composite that I did not include for the five-part series in an attempt to fine-tune the composite as much as possible.
- Similar to a composite picture that is used for criminal investigations, the composite “picture” for households' difficulty in paying regular expenses will not be an exact “picture” and there is no guarantee that there are people who fit the description exactly.
- At best it is an approximation designed to stimulate your thought processes.
- The “picture” may vaguely resonate for some readers while it may appear highly familiar for others.
Summary
- The composite person with the highest percentage:
- A Hispanic or Latino female who is 25-29 years old, with less than a high school degree, earning less than $25,000 per year and living in a household of seven or more people.
- The person with the lowest percentage is:
- An Asian male who is 65 years or older, with a bachelor's degree or higher, earns $200,000 or more and lives in a household of two people.
- The person who has seen the biggest percentage increase since 8/31/20 is:
- A White female who is 18-24 years old, with some college education or an associate's degree, earns $50,00-$74,999 and lives in a household of seven or more.
- The person who has seen the smallest percentage point increase is:
- An Asian male who is 65 years or older, with a bachelor's degree or higher, making $200,000 and over and lives in a household of two people.
- An Asian male who is 65 years or older, with a bachelor's degree or higher, making $200,000 and over and lives in a household of two people.
- The person with the highest percentage is:
- A female of two or more races and is 18-24 years old, with less than a high school education, earning $35,000-$49,999 and lives in a household of seven or more.
- The person with the lowest percentage is:
- An Asian male who is 65 years or older, with a bachelor's degree or higher, earning $200,000 or more and lives in a household of two people.
- The person who has experienced the biggest percentage point increase since 8/31/20 is:
- A White female, 18-24 years old with less than a high school education, earning $100,000-$149,999 and lives in a household of seven or more people.
- The person who has experienced the smallest percentage point increase is:
- An Asian male who is 25-39 years old with less than a high school education, earning $25,000-$34,999 per year and living in a household of six people.
- An Asian male who is 25-39 years old with less than a high school education, earning $25,000-$34,999 per year and living in a household of six people.
- The person with the highest percentage is:
- An Asian male who is 18-24 years old, with some college education or an associate's degree, earning $35,000-$49,999 and lives in a household of six people.
- The person with the lowest percentage is:
- A female who is either White or a person of two or more races, is 65 years or older with a bachelor's degree or higher and lives in a household of seven people or more.
- The person who has experienced the biggest percentage point increase since 8/31/20 is:
- A White male who is 55-64 years old, has some college education or an associate's degree, earns $100,000-$199,999, and lives in a household of six people.
- The person who has experienced the smallest percentage point increase is:
- A female of two or more races who is 18-24 years old with less than a high school education, falls into one of two earnings brackets: less than $25,000 or $35,000-$49,999 and lives in a household of five people.
- The person with the highest percentage is:
- A Hispanic or Latino female who is 18-24 years old, with some college education or an associate's degree, earning less than $25,000 per year and lives in a household of seven people.
- The person with the lowest percentage is:
- An Asian male who is 65 years or older with less than a high school education who earns $200,000 or more and lives in a household of two people.
- The person who has experienced the biggest percentage point decrease since 8/31/20 is:
- A White male who is 45-54 years old, with a high school or GED level of education, earning $100,000-$149,999 and lives in a household of six people.
- The person who has experienced the smallest percentage point increase is:
- A Black female who is 25-39 years old, with less than a high school education, earning less than $25,000 and lives in a household of six people.
Observations
Closing Thoughts
- The purpose of this “composite picture” exercise was not to pinpoint people who fit the description.
- It is intended more to highlight the fact that difficulty in paying regular expenses is not a homogenous event throughout the population.
- What the individual and composite data does highlight is that the percentage of people experiencing some level of difficulty paying their regular expenses has grown.
- I have discussed my belief that we have a bifurcated economy and that the bifurcation can be measured in different ways.
- The five-part series highlighted the bifurcation through five different “lenses”.
- Today's analysis highlights the bifurcation a different way.
- Even on a composite basis, there is not a clear theme about the type of person who is suffering the most difficulty in paying regular expenses.
- Some may question whether some of those composite people really exist.
- The one that stands out is the person with the smallest percentage decrease in the No Difficulty category (Asian male who is 65 years or older with less than a high school education, earns $200,000 or more per year and lives in a household of two people).
- You may say that is totally unrealistic.
- I would simply suggest that, as I thought about that, the person who comes to mind that could fit that description would be a successful small business owner who built their business from the ground up based on a skill they had rather than education.
- My point is that, as long as your thought processes have been stimulated and rational discussions occur, then better understanding of the situation may be achievable whether the composite “pictures” are completely accurate or not.
- Not to sound like a broken record, but the composite “picture” highlights the message that I have repeated on several occasions (not my original thought): we may all be in the same storm, but we are not all in the same boat.
- To add to that message: we may not all be in the same storm at the same time.
- For some, the economic “weather” is fine, and so is their financial “boat”.
- For others, the economic “storm” has already arrived, and they are struggling to keep their financial “boat” afloat.
Economic Data
|
Data |
Time Period Being Reported |
Current |
Previous |
Comments |
|
7/29/24 |
|
|||
|
Dallas Federal Reserve Manufacturing Activity Index |
July |
-17.5 |
-15.1 |
Further deterioration in the manufacturing sector in the Dallas region. |
|
7/30/24 |
|
|||
|
FHFA House Price Index |
May |
+5.7% |
+6.5% |
Prices are still rising but, at a slower pace. |
|
S&P-Core Logic House Price Index |
May |
+6.8% |
+7.3% |
Same story as the FHFA index. |
|
Consumer Confidence |
July |
100.3 |
97.8 |
Rising hopes for reductions in interest rates buoyed confidence. |
|
Job Opening and Labor Turnover Report (JOLTS)-Job Opening |
June |
8,180,000 |
8,230,000 |
Job openings fell slightly. |
|
Dallas Federal Reserve Services Activity Index |
July |
7.7 |
1.9 |
In contrast to the decline in manufacturing activity, service sector activity rose in the Dallas region. |
|
MBA Mortgage Applications |
7/24/24 |
-3.9% |
-2.2% |
This is the second week in a row of declines. |
|
7/24/24 |
-1.5% |
-4.0% |
Buyers appear to be on strike over high prices. |
|
7/24/24 |
-7.0% |
+0.2% |
With no movement in mortgage rates, refinancing activity slowed. |
|
ADP Nonfarm Payroll-Monthly Change |
July |
122,000 |
155,000 |
This continues a pattern of slowing jobs growth. |
|
Employment Cost Index |
2nd Quarter |
+0.9% |
+1.2% |
The pace of growth slowed from the 1st quarter. |
|
2nd Quarter |
+0.9% |
+1.1% |
Wage growth slowed slightly. |
|
2nd Quarter |
+1.0% |
+1.1% |
The pace of growth for benefits barely slowed. |
|
S&P Global Manufacturing PMI |
July |
49.6 |
51.6 |
Manufacturing slipped deeper into contraction. |
|
ISM Manufacturing PMI |
July |
46.8 |
49.5 |
ISM's version showed the same pattern of contraction. |
|
Challenger Job Cuts Year-Over-Year Growth |
July |
+9.2% |
+19.8% |
The pace of intended layoffs slowed in July. |
|
Initial Jobless Claims |
7/27/24 |
249,000 |
235,000 |
Initial claims continue to rise. |
|
Continued Claims |
7/20/24 |
1,877,000 |
1,844,000 |
People are finding it harder to find a new job when they are laid off. |
|
Nonfarm Productivity |
2nd Quarter |
+2.3% |
+0.4% |
Companies are improving productivity to fight labor shortages and profit margin pressures. |
|
2nd Quarter |
+0.9% |
+3.8% |
The Federal Reserve will be encouraged to see labor costs slowing. |
|
8/2/24 |
|
|||
|
Nonfarm Payrolls Monthly Change |
July |
+114,000 |
+179,000 |
Growth is slowing but the 3-month average is still faster than what existed in 2019. |
|
Average Hourly Earnings Year-Over-Year Growth |
July |
+3.6% |
+3.9% |
The Federal Reserve will be encouraged by the slowing wage growth; employees may not. |
|
Labor Force Participation Rate |
July |
62.7% |
62.6% |
The labor force continues to grow. |
|
Unemployment Rate |
July |
4.3% |
4.1% |
352,00 new people reported they were unemployed. |
|
Factory Orders Monthly Change |
June |
-3.3% |
+0.5% |
All of the decline was due to declines in transportation orders (i.e. airplanes). |
|
Economic Data |
Time Period Being Reported |
What was the Result? |
What was the Previous Result? |
Comments |
|
4/29/24 |
|
|
|
|
|
Dallas Federal Reserve Manufacturing Index |
April |
-14,5 |
-14.4 |
Essentially unchanged from March. |
|
4/30/24 |
|
|
|
|
|
Employment Cost Index Annualized Change |
1st Quarter |
+1.2% |
+0.9% |
Wage increased surprised to the upside similar to inflation increases. |
|
FHFA Home Price Index Year-Over-Year Change |
February |
+7.0% |
+6.5% |
This is two-month-old data but still shows home prices rising. |
|
S&P Core Logic Home Price Index Year-Over-Year Change |
February |
+7.3% |
+6.3% |
Same trend as the FHFA results. |
|
Chicago Purchasing Managers Index (PMI) |
April |
37.9 |
41.4 |
Continued evidence of manufacturing sector activity contracting. |
|
Conference Board Consumer Confidence Index |
April |
97.0 |
103.1 |
Rising food costs and gas prices were the primary reason for the decline in confidence. |
|
April |
142.9 |
146.8 |
The drop is not as big as the Future Expectations result. |
|
April |
66.4 |
74.0 |
Consumers are more worried about the future than their present situation. |
|
Dallas Federal Reserve Service Sector Activity Index |
April |
-10.6 |
-5.5 |
The Texas region is one of the few regions where both the Manufacturing and Service Sector activity is contracting. |
|
5/1/24 |
|
|
|
|
|
Mortgage Applications Weekly Change |
4/26/24 |
-3.3% |
-2.7% |
Applications continue to decline. |
|
4/26/24 |
-2.0% |
+5.0% |
The rush to lock in a mortgage rate appears to have run its course. |
|
4/26/24 |
-3.0% |
+0.50% |
The continued rise in rates caused refinance activity to decline. |
|
ADP Payroll Employment |
April |
+192,000 |
+208,000 |
Jobs growth slowed slightly but still remains solid. |
|
Construction Spending |
April |
-0.2% |
-0.3% |
Little change from March. |
|
S&P Global Manufacturing PMI |
April |
50.0 |
51.9 |
Activity slowed but just barely remained positive. |
|
ISM Manufacturing PMI |
April |
49.2 |
50.3 |
The ISM version of PMI fell below 50 and is now in contraction mode. |
|
Job Openings and Labor Turnover Survey (JOLTS) |
April |
8,488,000 |
8.813,000 |
Job openings declined by 325,000. |
|
5/2/24 |
|
|
|
|
|
Challenger Job Cuts Year-Over-Year Change |
April |
-3.3% |
+0.7% |
Jobs cuts declined in April after barely increasing in March. |
|
Trade Balance |
March |
-$69.4 billion |
-$60.5 billion |
The trade balance was basically unchanged. |
|
Initial Jobless Claims |
4/27/24 |
208,000 |
208.000 |
No change from the previous week. |
|
Continuing Claims |
4/20/24 |
1,744,000 |
1,774,000 |
Decreased 30,000 |
|
Nonfarm Productivity Annualized Rate |
1st Quarter |
+0.3% |
+3.5% |
This is the weakest growth since 1st quarter 2023. |
|
Unit Labor Costs Annualized Rate |
1st Quarter |
+4.7% |
-0- |
This will not give the Federal Reserve any comfort as employers will most likely try to pass this increased cost through to the final buyer. |
|
Factory Orders Monthly Change |
March |
+1.6% |
+1.2% |
This was the second consecutive month of an increase. |
|
March |
+0.5% |
+1.2% |
Order growth slowed but remained positive. |
|
5/3/24 |
|
|
|
|
|
Growth of Nonfarm Payrolls Monthly Change |
April |
175,000 |
303,000 |
First signs of jobs growth showing fatigue. |
|
Labor Force Participation Rate Monthly Change |
April |
62.7% |
62.7% |
No change |
|
Unemployment Rate |
April |
3.9% |
3.8% |
Inching towards 4.0% |
|
Average Weekly Earnings |
April |
3.9% |
4.1% |
This will probably be welcome news for businesses and the Federal Reserve but, disappointing new for the average worker. |
|
ISM Non-manufacturing PMI |
April |
49.4 |
51.4 |
The service sector has now slipped into contraction based on this index. |
|
S&P Global Services PMI |
April |
51.3 |
51.7 |
S&P Global's service index has not yet slipped into contraction territory. |

Steve is the Economist for Washington Trust Bank and holds a Chartered Financial Analyst® designation with over 40 years of economic and financial markets experience.
Throughout the Pacific Northwest, Steve is a well-known speaker on the economic conditions and the world financial markets. He also actively participates on committees within the bank to help design strategies and policies related to bank-owned investments.
The Economic Perspectives newsletter is comprised entirely of the expertise, thoughts, perspectives and opinions of the author with no use of generative AI. Data is sourced from the original providers (typically government agencies) and analyzed by the author.