As we consider future economic growth and potential impacts related to tariffs and labor supply, I thought it would be informative to examine an industry that plays a major role in economic growth. That industry is the Construction industry. This week we will the examine construction industry through the lens of construction spending.
Soundbite.
Construction spending is a major factor in US economic growth. The most recent data from the Bureau of Economic Analysis indicates that construction spending has slightly more than a three times multiplier effect on the US economy.
-
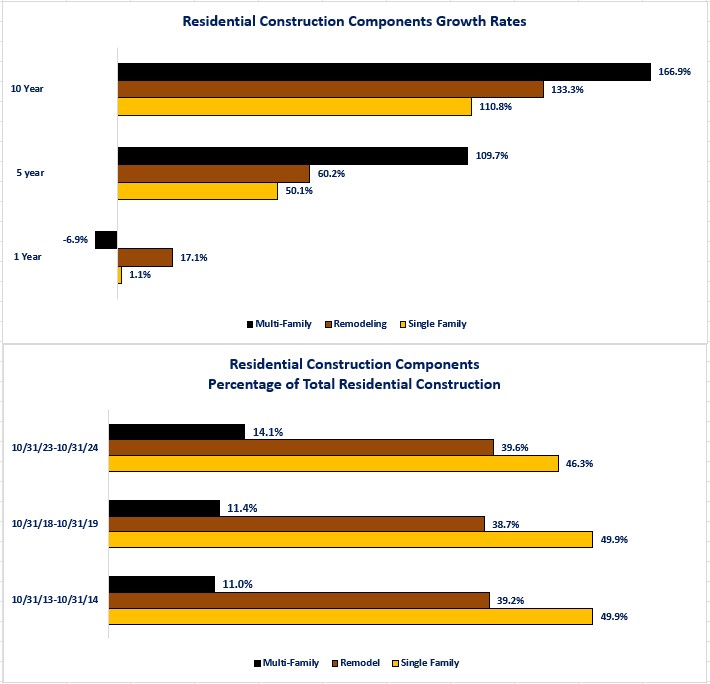
For residential construction spending, multi-family construction had the strongest growth rates over the past five and ten years but, spending on remodeling construction led the way over the past year.
-
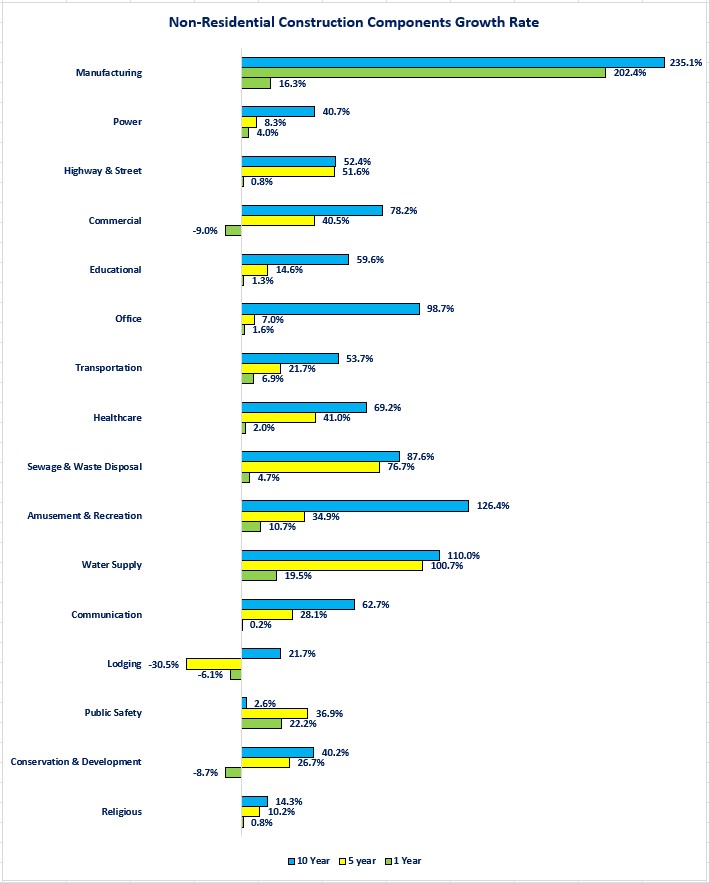
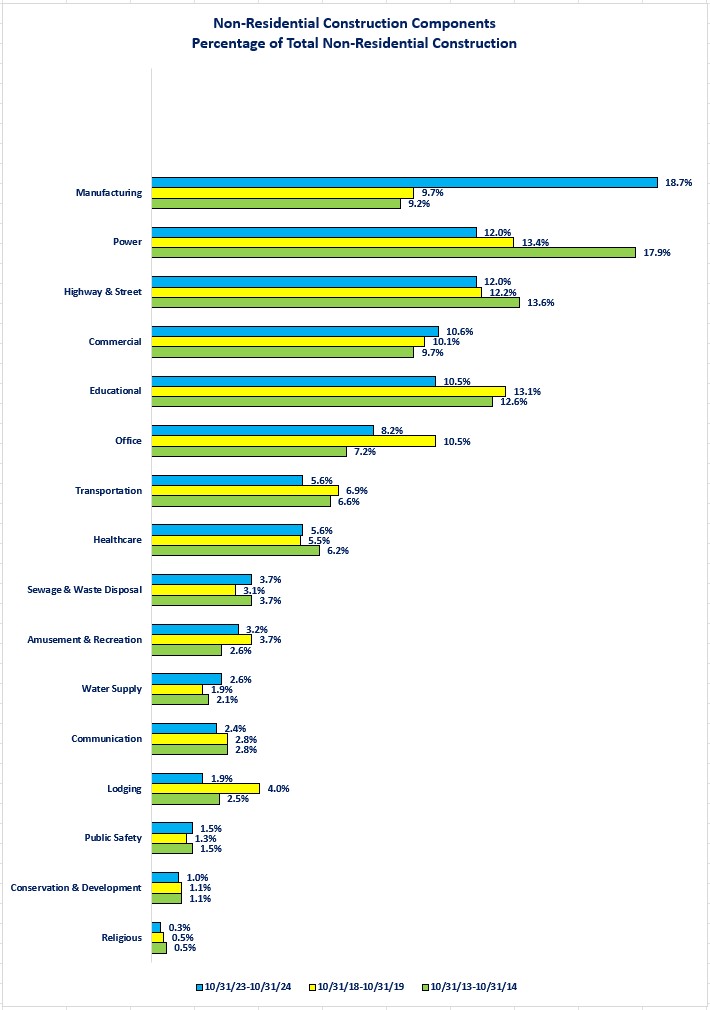
For non-residential construction, spending on manufacturing construction has dominated the non-residential construction spending over the past one, five and ten years.
The Construction industry has clear exposure to both tariffs and deportation as the industry relies on almost a third of its construction materials via imports, and undocumented immigrants make up over ten percent of its workforce.
Disclosures.
Construction spending data comes from the Census Bureau and is as of 10/31/24.
Today's Perspectives section will focus on four areas related to Construction spending.
-
Residential versus Non-Residential construction spending.
-
Growth rates
-
Percentage of total construction spending.
-
-
Components of residential construction spending.
-
Growth rates
-
Percentage of total construction spending
-
-
Components of non-residential construction spending.
-
Growth rates
-
Percentage of total construction spending.
-
-
Risks to monitor
-
Tariffs
-
Labor supply
-
Observations.
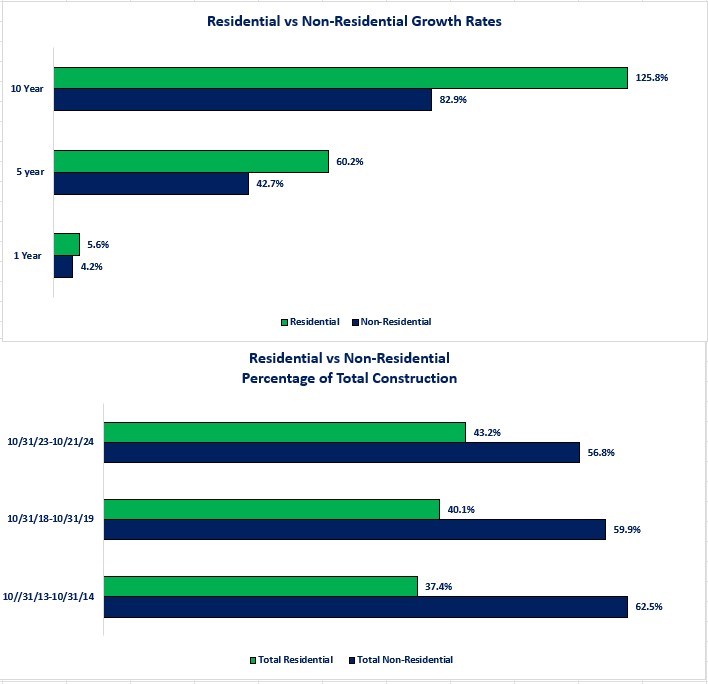
Let us start by examining the two major components of construction spending-residential versus non-residential construction spending. Remember that spending is in dollars so, it should not be surprising that non-residential construction spending makes up a larger percentage of total construction spending than residential since the cost of buildings is more than homes.
-
Over the past one, five and ten years, residential construction spending has experienced the fastest grown rate.
-
As a result, it now makes up a larger percentage of total construction spending.
-

Now let us drill down and examine the three components of residential construction spending: single-family homes, multi-family units and remodeling.
-
Multi-family construction spending has experienced the strongest growth rates for the five- and ten-year time periods but, has contracted in the last year.
-
High interest rates are one factor, possible over-building may be another.
-
-
With the rise in interest rates, existing homeowners have turned to remodeling rather than giving up their low mortgage rate to buy a bigger home.

Next, let us now examine the growth rates and percentage of total construction spending for the components of non-residential construction spending. You may be surprised to learn that there are 16 sub-categories of non-residential construction spending.
-
Strong growth in construction spending in the Manufacturing category has resulted in this sector of construction spending leapfrogging from the fifth largest percentage of total non-residential construction spending in 2014 to the largest as of 2024.
-
Much of this has been driven by the manufacturing activity tied to increasing the US' capacity for manufacturing computer chips and related products as well as EV batteries and parts.
-
-
Only the Lodging sector has experienced negative growth over the five-year period while Commercial, Conservation & Development and Lodging have experienced a negative growth rate in construction spending over the past year.


Tariffs
The Construction industry clearly has exposure to tariffs. A study by the OEC found that 32% of building materials are imported. The National Association of Homebuilders states that 7.3% of materials used to build homes are imported.
-
The table below shows the top five countries for construction material production.
-
Even though they are not in the top five, Canada and Mexico are also major suppliers of building materials to the US.
-
The OEC shows that, as of 2022, the US imported 25% of iron and steel from Canada.
-
The NAHB states the US home builders also import cement, and gypsum from both Mexico and Canada.
-
-
Whether any of these products have new or higher tariffs imposed on them remains to be seen but understanding where the exposure is helps the construction industry as it builds contingency plans.
| Country | Materials Produced |
|---|---|
| China | Cement and Steel |
| United States | Cement, Steel and Wood Products |
| India | Cement and Steel |
| Japan | Cement, Steel and Pre-fabricated Building Products |
| Germany | Cement, Steel, Advanced Building Systems and Engineering Services |
Labor Supply
The Construction industry, along with other industries, has struggled with finding enough qualified help for the past five years, or longer.
-
Deportation of all undocumented immigrants poses a labor shortage risk for the Construction industry.
-
A study by the Pew Research Center found that undocumented workers comprise 13% of the construction industry workforce-more than double the overall US workforce.
-
A study by the Harvard Joint Center for Housing Studies found that the states with the biggest exposure to undocumented workers in the Construction industry were California, District of Columbia, New Jersey and Texas.
-
All have more than 50% of their Construction industry workforce as undocumented workers.
-
-
Closing thoughts.
- At its most basic level, construction spending is what is needed to build things.
-
The simplistic concept is that if we do not build structures, for a wide variety of purposes, we would still be living a nomadic life.
-
- From an economic perspective, construction spending is a major factor in economic growth.
-
Based on data from the Bureau of Economic Analysis, construction spending has approximately a three-times multiplier effect for the economy.
-
That means that a dollar spent on construction results in another three dollars being spent.
-
Based on the latest GDP data, and with the multiplier effect, the overall impact of construction spending accounted for over 18% of economic growth.
-
The Construction industry multiplier effect ranks 5th out of 65 categories in the BEA data.
-
-
-
For anyone who thinks that construction jobs are just “grunt” work and that white collar jobs are the only road to success should consider the following:
-
The average weekly earnings in the Construction industry are in the top 40% of all US industries.
-
The Construction industry has 2.3 times more jobs than the top three industries for wages (Utilities, Mining & Logging, Information) combined.
-
No, I am not being paid by the construction industry!
-
-
-
The Construction industry clearly has exposure to any changes in building material costs and labor supply.
-
As I have stated over the past two weeks, it is way too early to know how many of the promises made during President-elect Trump's campaign and recent social media posts will actually be implemented.
-
-
Not to sound like a broken record, but, for businesses in the Construction industry or who have reliance on the Construction industry for their business, now is the time to be monitoring risk and developing contingency plans for the risks-and benefits-that may result from a new Administration.
-
Those who are prepared are those who may be able to take advantage of opportunities that arise from change.
-
Economic data.
| Data | Time Period Reported | Current Results | Previous Results | Comments |
|---|---|---|---|---|
| 12/2/24 | ||||
| S&P-Global Manufacturing PMI | November |
49.7 |
48.5 |
Activity in the manufacturing sector improved but, remains below the neutral level of 50. |
| ISM Manufacturing PMI | November |
48.4 |
46.5 |
The story is the same for this version of national manufacturing activity. |
| Construction Spending Monthly Change | October |
+0.4% |
+0.1% |
Construction in the Manufacturing sector continues to drive the growth. |
| 12/3/24 |
|
|
||
| JOLTS Job Openings | October |
7,744,000 |
7,372,000 |
Businesses continue to struggle to find qualified help. |
| 12/4/24 |
|
|
||
| MBA Mortgage Applications Weekly Change | 11/29/24 |
+2.8% |
+6.3% |
Once again, the increase was solely due to increases in applications to purchase a house. |
|
11/29/24 |
+5.6% |
+12.2% |
This is the 4th consecutive week of increases. |
|
11/29/24 |
-.06% |
-2.6% |
High mortgage rates continue to dampen demand for refinancing. |
| ADP Nonfarm Payrolls Monthly Change | November |
146,000 |
184,000 |
The service sector added 140,000 jobs while the goods producing sector only added 6,000 jobs. |
| S&P-Global Services PMI | November |
56.1 |
55.0 |
The service side of the economy continues to show improving activity. |
| ISM Non-Manufacturing PMI | November |
52.1 |
56.0 |
In contrast to the S&P-Global results, the ISM service sector PMI showed slowing. |
| Factory Orders Monthly Change | October |
+0.2% |
-0.2% |
Orders rose for both durable and non-durable goods. |
|
October |
+0.1% |
+0.1% |
Excluding transportation (i.e. aircraft), the pace of growth was the same as October. |
| 12/5/24 | ||||
| Challenger Layoff Announcements Year-Over-Year Change | November |
+26.8% |
50.9% |
The pace of announced layoffs slowed as the economy continues to show strength. |
| Initial Jobless Claims Weekly Change | 11/30/24 |
224,000 |
215,000 |
Initial claims continue to show no trend as claims have been rising and falling within a range. |
| Continuing Jobless Claims Weekly Change | 11/23/24 |
1,871,000 |
1,896,000 |
Continued claims also remain range bound. |
| Trade Balance | October |
-$73,8 Billion |
-$84.4 Billion |
The trade deficit narrowed as imports fell more than exports. |
|
October |
-$339.6 Billion |
-$352.3 Billion |
Exports fell in October. We will need to monitor November and December for signs of stockpiling in advance potential tariffs. |
|
October |
+$265.7 Billion |
+$267.9 Billion |
Exports fell slightly as a stronger dollar made US goods more expensive. |
| 12/5/24 | ||||
| Nonfarm Payrolls Monthly Change | November |
227,000 |
12,000 |
November unwound the distortions in October that were created from the hurricanes and Boeing strike. |
| Average Weekly Earnings Year-Over-Year Change | November |
+3.7% |
+4.0% |
Wage growth slowed slightly but, remained above the official inflation rate. |
| Unemployment Rate | November |
4.2% |
4.1% |
The unemployment rate rose slightly but is still within the range that it has been in. |
| Labor Force Participation Rate | Novemer |
62.5% |
62.6% |
The Labor Force Participation rate has declined for three consecutive months. |
| University of Michigan Consumer Sentiment Index | December |
74.0 |
71.8 |
All of the improvement was due to a surge in confidence about the future. |
|
December |
77.7 |
63.9 |
In a reversal of a longstanding trend, consumer's outlook for the future surged. |
|
December |
71.6 |
76.9 |
Consumers may be more confident about the future but they became less optimistic about their current situation. |

Steve is the Economist for Washington Trust Bank and holds a Chartered Financial Analyst® designation with over 40 years of economic and financial markets experience.
Throughout the Pacific Northwest, Steve is a well-known speaker on the economic conditions and the world financial markets. He also actively participates on committees within the bank to help design strategies and policies related to bank-owned investments.


