Perspectives
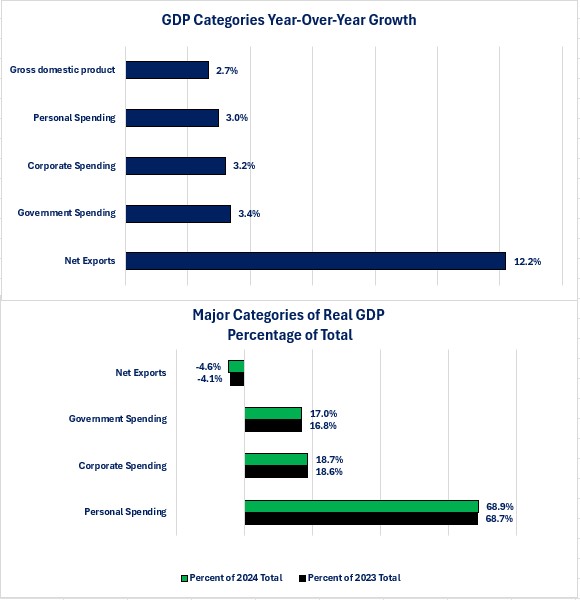
The Bureau of Economic Analysis (BEA) released its first estimate of third quarter economic growth as measured by Real Gross Domestic Product (GDP). The report showed that the economy grew at a 2.7% year-over-year pace. That is down slightly from the 3.0% pace in the second quarter, but still solid growth. Today's Perspectives examines the categories that make up GDP to help us understand what is driving economic growth.
Soundbite
Observations
The BEA breaks out the GDP data into three major spending categories plus net exports.
Spending Categories
-
Personal Spending
-
Business Spending
-
Government Spending
Net Exports equal Exports minus Imports
-
Exports add to GDP growth since they generate revenue for US exporters.
-
Imports subtract from GDP growth because the foreign country receives the revenue.
-
Since the US is a net importer, Net Exports are usually negative and subtract from GDP growth.
I am going to provide data and perspective on the year-over-year growth of the three major spending categories as well as what percentage of GDP growth each categories comprises. I will then provide the same data and analysis for the subcomponents of each of the three spending categories.
Gross Domestic Product Composition and Growth-
All three spending categories showed year-over-year growth at or above 3%. The contribution percentage showed little change with Net Exports showing the biggest relative change from -4.1% to -4.6%.

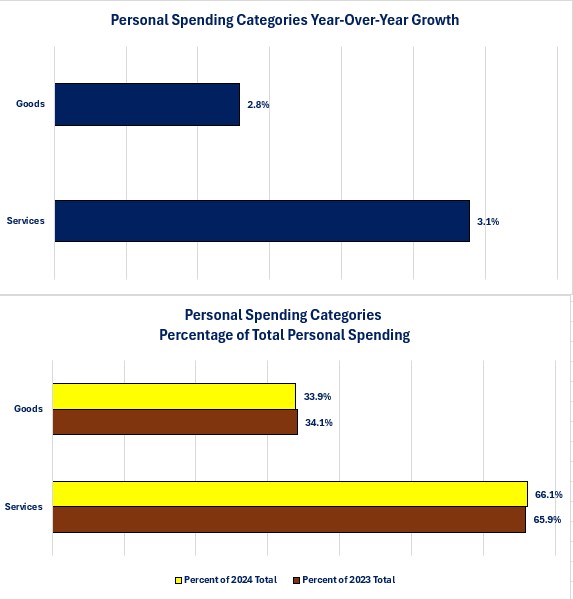
Personal Spending Components
-
Consumers spent double the amount on Services as they did for Goods. This is because Service purchases tend to be recurring purchases (i.e., you see your dentist and doctor's annually and pay your cell phone and streaming services bills monthly) while the big-ticket Goods purchases are far less frequent (i.e., you do not buy a car, furniture or appliances annually or monthly).
-
Spending on Services increased faster than Goods with the result being that spending on Services grew from 65.9% of total Personal Spending to 66.1%.

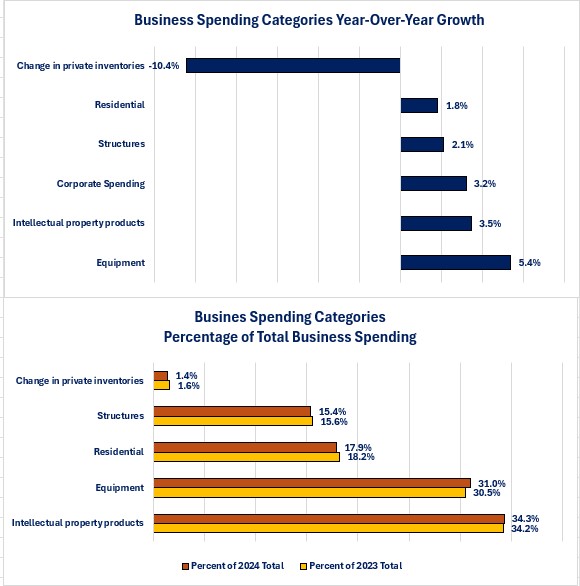
Business Spending Components
-
Although the growth in spending in the Equipment category was the fastest on a year-over-year basis, spending in the Intellectual Property Products category still made up the largest percentage of total Business Spending.
-
Intellectual property spending is evidence that businesses are responding to labor shortages and rising wage pressures by focusing on technology to become more efficient. Being able to produce more goods or services with the same amount or fewer employees can help businesses absorb higher costs without necessarily passing those costs through to the final product.

Government Spending Components
-
It probably comes as no surprise that the category of Government Spending with the fastest year-over-year growth was National Defense Spending category given the support that the US is providing to Ukraine and Israel.
-
The National Nondefense category shrank slightly as a percentage of total Government Spending as the National Defense category gained. The State & Local Government spending category also saw a slight increase in its percentage of overall Government spending. Many state and local governments are still spending funds received from the fiscal stimulus funds. Many projects take years to spend the funds and complete the projects.
Closing Thoughts
- US economic growth continues to surprise many people as the economy continues to grow at a faster pace than what occurred for most of the decade after the financial crisis recession.
-
The economy averaged a 2.4% growth rate over the decade of 2009 to 2019.
-
-
Consumers continue to be the driving force for economic growth.
-
It is important to understand that there is not one homogenous “consumer”, and that this expansion is best described as a “K” shaped expansion.
-
Those who own financial assets or real assets are doing fine and powering the spending growth. This sector of the population has done well even with the inflation issues (this is the up leg of the K).
-
Financial assets have grown since the end of the pandemic crisis and have offset or outperformed inflation growth.
-
Real assets that generate income have provided income for the past two years that helped offset or outpace inflation.
-
For people who own assets, their net worth has increased.
-
-
Those who do not own financial or real assets and have only their paycheck as a source of income have suffered heavily (this is the down leg of the K).
-
For two consecutive years, average weekly earnings growth was less than inflation growth.
-
Even though wage growth is now above the published inflation rate, for many it is not above the inflation rate of the goods and services that they purchase (i.e. rent, day care, auto, home and medical insurance, groceries and utility payments).
-
This part of the population has already been forced to make hard decisions on how to cut spending to pay for their basic needs and make their debt payments.
-
-
-
The outlook for economic growth for 2025 currently looks positive.
-
Economic growth may slow as interest rates start to come down and the income generated from interest and rental income declines.
-
Any type of major decline in the stock markets could also slow spending as net worth is impacted.
-
The reality of needing to pay down outstanding debt may also slow growth as spending that happened by incurring debt is now replaced by the payments that have to now occur to pay down that debt.
-
-
Remember that there is still an underlying support to the economy for next year.
-
Funds from the three fiscal stimulus acts that were passed during the Biden administration are still being distributed.
-
CHIPS Act
-
Infrastructure Act
-
Inflation Reduction Act
-
-
-
The challenge in trying to forecast future economic growth is that this has been a unique economic cycle. As a result, all the historically reliable leading indicators that help warn us that a recession is approaching have failed.
-
We have had an economic cycle that was jump started with over $5 trillion in stimulus that was not paid for with taxes.
-
As a result, all the econometric models that rely on past history to help forecast future economic growth have struggled mightily to incorporate the ripple effects of the stimulus funds.
-
-
Because of these dynamics, I continue to advocate that we ignore the noise of politics and social media and pay attention to what is actually happening around us.
-
You and your business will see changes in the economy far faster than the economic data. Believe what you are seeing and experiencing.
-
If what you and your business are experiencing does not match what you are reading or watching on social media, then the “simple” solution is to stop reading and/or watching social media!
-
Recognizing that is probably unrealistic and not going to happen, then a more realistic strategy is to believe what you are experiencing if it is different than what you are reading or watching.
-
-
Economic Data
|
Data |
Reporting Period |
Results |
Previous Results |
Comments |
|
10/28/24 |
|
|
|
|
|
Dallas Federal Reserve Manufacturing Index |
October |
-3.0 |
-9.0 |
Manufacturing activity showed improvement in October but remains negative. |
|
10/29/24 |
|
|
|
|
|
Trade Balance |
September |
-$108.23 billion |
-$94.2 billion |
The trade deficit widened by $14 billion as exports fell $3.6 billion and imports rose $10.4 billion. |
|
Retail Inventories |
September |
+0.1% |
+0.5% |
Retailers increased inventories at a slower pace than August. |
|
Wholesale Inventories |
September |
-0.1% |
+0.1% |
Wholesalers decreased their inventories in September. |
|
FHFA Home Price Index Monthly Change |
August |
+4.2% |
+4.5% |
Home price inflation continues, but at a slightly slower pace. |
|
S&P-Case Shiller Home Price index Monthly Change |
August |
+5.2% |
+5.9% |
This home price index shows a slowing in the pace of home price increases. |
|
Consumer Confidence |
October |
108.7 |
96.7 |
Confidence grew for the consumers surveyed. Confidence grew in both their current situation and their outlook for the future. |
|
Job Openings |
September |
7,443,000 |
7,861,000 |
US businesses reduced the number of job openings. |
|
10/30/24 |
|
|
|
|
|
MBA Mortgage Applications Weekly Change |
10/25/24 |
-0.1% |
-6.7% |
The pace of decline slowed and was driven by continued declines in applications to refinance. |
|
10/25/24 |
+5.0% |
-7.2% |
Even though mortgage rates rose, more people were willing to pursue buying a house. |
|
10/25/24 |
-6.3% |
-26.3% |
The rise in mortgage rates continues to stifle demand to refinance existing mortgages. |
|
ADP Nonfarm Payrolls Monthly Change |
October |
233,000 |
143,000 |
Jobs growth picked up in October. |
|
GDP Year-Over-Year Growth First Estimate |
3rd Quarter |
2.7% |
3.0% |
Growth remains solid with consumer spending ac acc |
|
GDP Price Index First Estimate |
3rd Quarter |
2.1% |
2.7% |
Energy prices helped bring down the growth rate. |
|
Pending Home Sales Monthly Change |
September |
+7.4% |
+0.6% |
Given the recent rise in mortgage rates, this type of increase will probably not be able to be sustained. |
|
10/31/24 |
|
|
|
|
|
Challenger Announced Layoffs Year-Over-Year Change |
September |
50.9% |
53.4% |
The pace of layoffs slowed compared to September but remains elevated compared to a year ago. |
|
PCE Price Index Year-Over-Year Change |
September |
2.1% |
2.2% |
Energy prices were the primary reason for the slowing pace. |
|
September |
2.7% |
2.7% |
Prices grew at the same pace as August. |
|
Personal Income Year-Over-Year Change |
September |
+5.5% |
+5.9% |
Growth in personal income slowed compared to September. |
|
September |
+3.1% |
+3.1% |
After taxes and inflation, personal income rose at the same pace of August. |
|
Personal Spending Year-Over-Year Change |
September |
+5.3% |
+5.3% |
Spending was unchanged from August but remains solid. |
|
September |
+3.1% |
+3.0% |
Spending after inflation grew slightly. |
|
Initial Jobless Claims Weekly Change |
10/26/24 |
216,000 |
228,000 |
Initial claims fell by 12,000. |
|
Continuing Claims Weekly Change |
10/19/24 |
1,862,000 |
1,888,000 |
Continuing claims fell by 26,000. |
|
10/31/24 |
|
|
|
|
|
Nonfarm Payrolls Monthly Change |
October |
12,000 |
223,000 |
Weather and strikes distorted the results. |
|
Unemployment Rate |
October |
4.1% |
4.1% |
No change |
|
Average Hourly Earnings Year-Over-Year Change |
October |
+4.0% |
+4.0% |
The Federal Reserve cannot be comfortable with the continued strong wage growth. |
|
Average Weekly Earnings Year-Over-Year Change |
October |
+4.0% |
+3.7% |
Wage growth increased from an average weekly perspective. |
|
Construction Spending Monthly Change |
September |
+0.1% |
+0.1% |
The pace of growth in construction spending was the same as August. |
|
ISM Manufacturing Index |
October |
46.5 |
47.2 |
Manufacturing activity contracted based on the ISM report. |
|
S&P Global Manufacturing Index |
October |
51.1 |
50.4 |
Manufacturing activity expanded based on the S&P Global reported. |

Steve is the Economist for Washington Trust Bank and holds a Chartered Financial Analyst® designation with over 40 years of economic and financial markets experience.
Throughout the Pacific Northwest, Steve is a well-known speaker on the economic conditions and the world financial markets. He also actively participates on committees within the bank to help design strategies and policies related to bank-owned investments.


