


One of President Trump's stated goals for new tariff taxes is to bring overseas manufacturing back to the US. Given that focus, today's Perspectives section examines the current state of US manufacturing.
Soundbite.
When measuring inflation-adjusted manufacturing results, we see that manufacturing in the US is alive and well. What has changed are two areas of manufacturing.
-
The type of manufacturing.
-
Over the past 30 years, 28 sub-industries have experienced their percentage of total manufacturing increase, 41 have seen their percentage of the total shrink.
-
-
The number of manufacturing jobs.
-
Total manufacturing jobs are lower now than thirty years ago.
-
If manufacturing industries are successfully returned to the US, it is not clear if the manufacturing sub-industries that have lost market share will be the sub-industries that return or if new manufacturing facilities will result in a substantial increase in manufacturing jobs. We may discover that most of the new plants will utilize robotics and automation to control costs and keep their prices competitive.
Disclosures.
-
The Census Bureau reports data on manufacturing inventories, orders, and shipments,
-
The most recent data is as of 2/28/25.
-
-
The Bureau of Labor Statistics reports data on manufacturing jobs.
-
The most recent data is as of 3/31/25.
-
-
The inventories, orders and shipment data have been adjusted for inflation to reflect increases/(decreases) due to volume rather than price.
-
Although the data accurately reflects the change in volume, it does not provide insight into the size of the orders (i.e., was the increase due to an increase in one huge order or multiple small orders?).
-
The period being examined is the last 30 years (i.e., 2/28/95 to 2/28/25).
-
Data sets being examined are:
-
New Orders
-
Shipments
-
Inventories
-
Inventory to New Orders Ratio
-
Inventory to Shipments Ratio
-
Manufacturing Jobs
-
Observations.
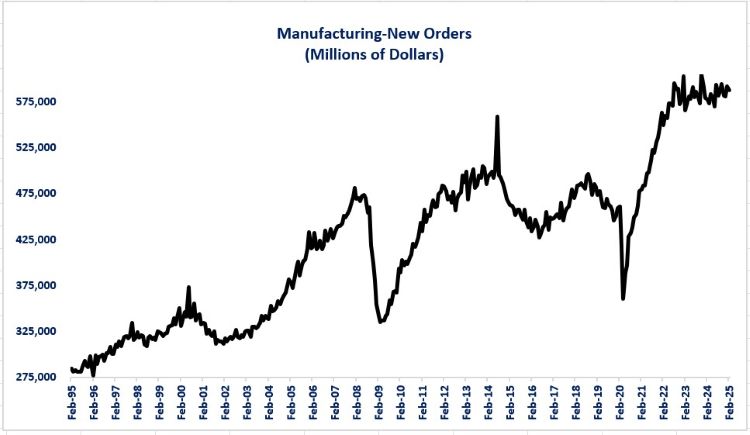
Let us start by examining new orders.
New Orders-
Other than declines during recessions, the trend for manufacturing orders were on a steady increase until 2014.
-
There was not a clear trend from 2014 to 2020 as orders rose and fell.
-
-
Orders surged after the end of the pandemic crisis and then leveled off. There has been no trend since 2022 as orders moved sideways.
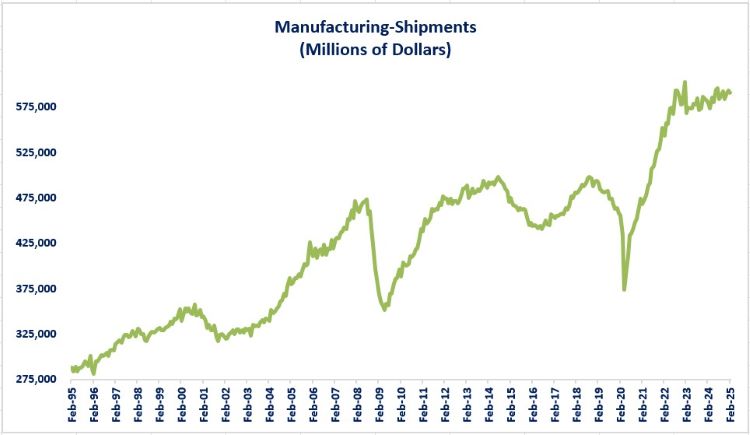
Shipments
-
A similar trend existed for shipments until 2024.
-
Different than orders, shipments show a slightly rising trend since 2024.
-
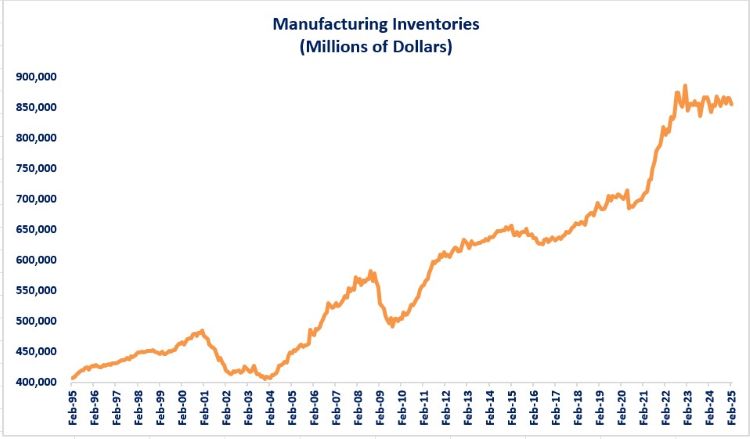
Inventories
-
The trend for inventories has shown a more consistent rising trend over the past 30 years than new orders or shipments.
-
The downturn that started in 2013 was smaller and the trend continued rising until the pandemic crisis compared the downturn that existed from 2018 to 2020 for orders and shipments.
-
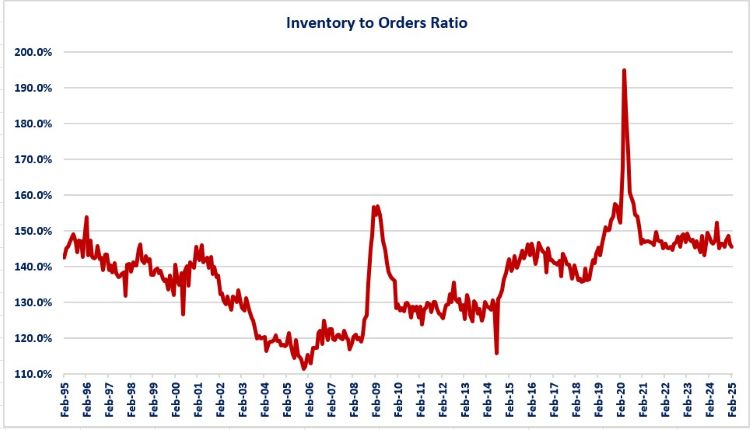
Inventories to Orders Ratio
- The inventories to orders ratio is a way to monitor if manufacturers are making more than they are selling. If so, the ratio would rise and indicate that production would slow to work off the inventory.
-
We can observe a declining ratio from 1995 to 2006.
-
After the 2007-2009 recession, the overall trend for the ratio was rising. It was clearly rising before the pandemic crisis and spiked during the crisis.
-
After the pandemic spike corrected, the ratio has been moving sideways but at elevated levels compared to the last 30 years.
-
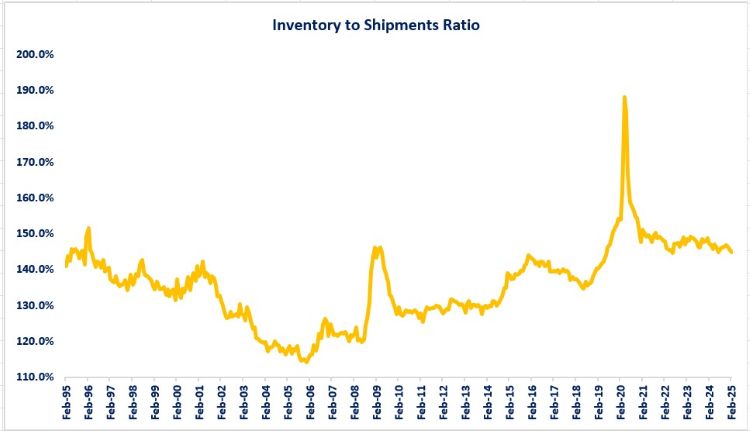
Inventory to Shipments Ratio
-
The inventory to shipments ratio shows a similar pattern to the inventory to new orders ratio.
-
The difference is that since the end of the pandemic crisis surge, the sideways movement has recently had a slight downward tilt.
-
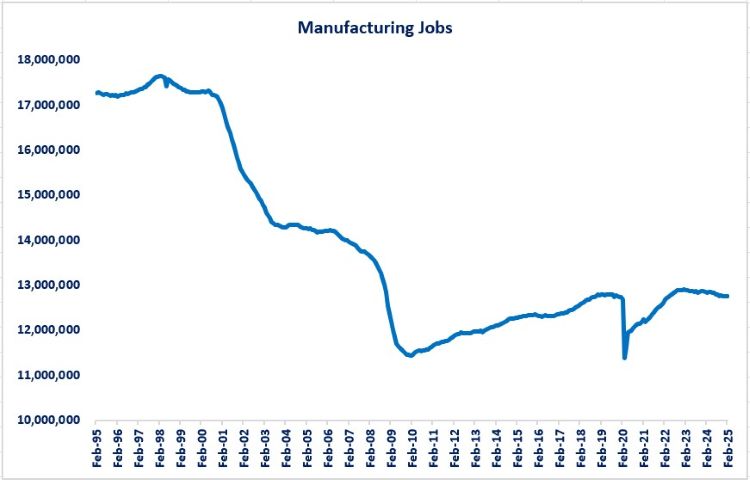
Manufacturing Jobs
-
The number of manufacturing jobs steadily declined from 1998 to 2010.
-
During the economic expansion of 2010-2019 the trend for manufacturing jobs reversed and jobs steadily rose until the pandemic crisis hit.
-
Since the post-pandemic re-opening of the economy, manufacturing jobs began rising and fully recovered their pandemic crisis losses until 2023.
-
Since 2023, the number of manufacturing jobs has shown a declining trend.
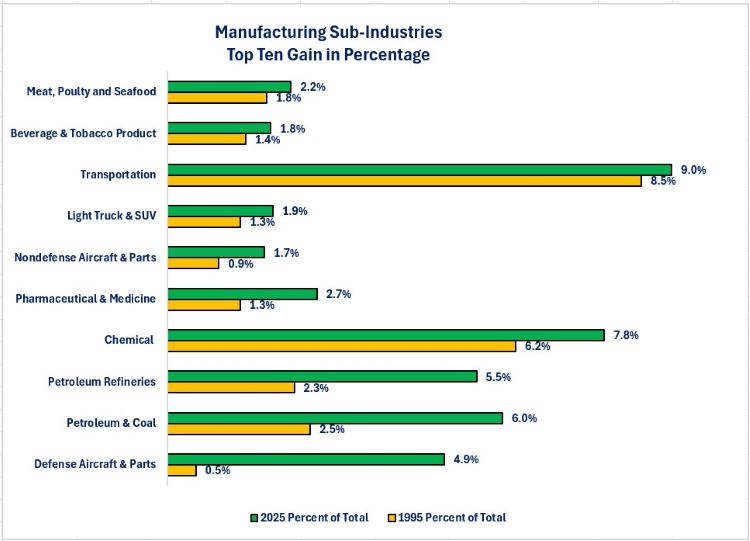
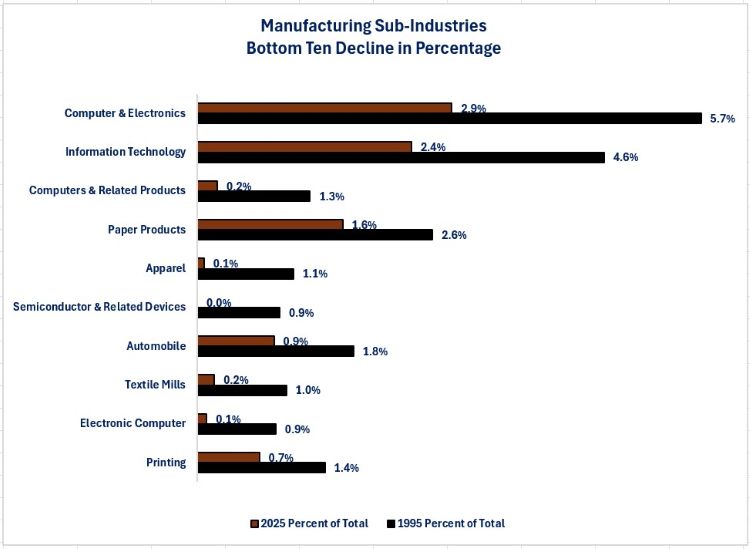
Change in Composition of Manufacturing
-
The Census Bureau lists 69 different manufacturing sub-indices.
-
Over the past 30 years, 41 industries have seen their percentage of total manufacturing shrink while 28 have seen their percentage increase.
-
The graphs below show the top ten sub-industries that grew in percentage and the bottom ten that shrank in percentage.
-
Closing thoughts.
-
When examining manufacturing results, we see that manufacturing in the US is alive and well. What has changed are two areas of manufacturing.
-
The type of manufacturing.
-
Over the past 30 years, 28 sub-industries have experienced an increase in their percentage of total manufacturing, while 41 have seen their percentage of the total decrease.
-
-
The number of manufacturing jobs.
-
Total manufacturing jobs are lower now than thirty years ago.
-
-
- The declining trend in the inventory ratios between 1995 to 2006 may be because of the move toward “just in time” inventory management that was occurring.
-
As a result, manufacturers were most likely responding to their customers “just in time’ strategy and began reducing the amount of inventory that they held to bring it to “just in time” levels.
-
-
The current elevated inventory ratios may be evidence that businesses and manufacturers have moved away from “just in time” inventory levels to “just in case” levels.
-
Anecdotal evidence indicates that after the tariffs of the first term of office for President Trump and then the pandemic crisis, many businesses are now holding more inventory in case supply chain disruptions occur again.
-
Manufacturers appear to be following the same strategy.
-
- The data does not show how many manufacturing firms now exist in the US compared to 30 years ago. What it does show is that US manufacturers are producing and shipping more goods than 30 years ago but with fewer employees.
-
The message is that US manufacturers are more productive than they were 30 years ago. Good news for manufacturers, bad news for workers.
-
-
If manufacturing industries are successfully returned to the US, it is not clear if it will result in a substantial increase in manufacturing jobs. We may discover that most of the new plants will utilize robotics and automation to control costs and keep their prices competitive.
Economic data.
|
Economic Data |
Time Period Being Reported |
Current Results |
Previous Results |
Comments |
|
4/14/25 |
|
|
|
|
|
No Economic Data Released |
|
|
|
|
|
4/15/25 |
|
|
|
|
|
Export Price Index Year-Over-Year Change |
March |
2.4% |
2.1% |
Foreign buyers of US goods saw inflation rise in March. |
|
Import Price Index Year-Over-Year Change |
March |
0.9% |
2.0% |
US buyers of foreign goods saw inflation slow in March. |
|
New York Federal Reserve Empire Manufacturing Activity Index |
April |
-8.10 |
-20.0 |
Manufacturing activity improved but remained negative. |
|
4/16/25 |
|
|
|
|
|
MBA Mortgage Applications Weekly Change |
4/11/25 |
-8.5% |
+20.0% |
Refinancing applications drove the decline. |
|
4/11/25 |
-6.0% |
+9.1% |
Higher mortgage rates along with continued high home prices slowed purchase activity. |
|
4/11/25 |
-12.7% |
+35.1% |
The rise in mortgage rates was the primary reason for the decline. |
|
|
6.81% |
6.61% |
Rates moved higher again after declining last week. |
|
Retail Sales Monthly Change |
March |
+1.4% |
+0.2% |
Fears of coming price increases appeared to motivate people to buy new cars and trucks now. |
|
March |
+0.4% |
+1.3% |
Core retail sales rose at a more muted pace. |
|
Industrial Productions Monthly Change |
March |
-0.3% |
+0.8% |
A 5.3% decline in utilities usage drove the decline. Manufacturing production rose 1.0%. |
|
NAHB Housing Market Index |
April |
40.0 |
39.0 |
The outlook from builders in the housing market improved slightly compared to March. |
|
4/17/25 |
|
|
|
|
|
Initial Jobless Claims |
4/12/25 |
215,000 |
224,000 |
There are still no signs of distress in the labor markets when examining initial jobless claims. |
|
Continuing Jobless Claims |
4/4/25 |
1,885,000 |
1,844,000 |
Continuing jobless claims rose 41,000. |
|
Housing Starts Monthly Change |
March |
-11.4% |
+9.6% |
All of the decline occurred in single family starts. Single fell 14.0% while multi-family starts were unchanged. |
|
Building Permits Monthly Change |
March |
+1.6% |
-1.0% |
Single family permits fell 2.0% while multifamily permits rose 10.0%. |
|
Philadelphia Federal Reserve Manufacturing Index |
April |
-26.4 |
12.5 |
Manufacturing activity in the Philadelphia region experienced a sharp downturn in April. |
|
4/18/25 |
|
|
|
|
|
No Economic Data Released |
|
|
|
|

Steve is the Economist for Washington Trust Bank and holds a Chartered Financial Analyst® designation with over 40 years of economic and financial markets experience.
Throughout the Pacific Northwest, Steve is a well-known speaker on the economic conditions and the world financial markets. He also actively participates on committees within the bank to help design strategies and policies related to bank-owned investments.