


The size and magnitude of the new tariff tax that were announced on 4/2/25 has many economists raising their probability of a recession or actually making a recession forecast. Given the noise, fear and uncertainty that exists around this new tariff tax, I thought it would be good to examine the official economic data that is used to make official inflation determinations. If we understand the base that we are starting from, we can then monitor how the data progresses, as the tariff tax is fully implemented.
Soundbite.
There has been much discussion and noise in the media about recessions including whether we are in one and who decides. No matter what you may have learned in school, two consecutive quarter of economic growth, in and of itself, does not mean an economy is in recession. Everyone may have their opinion of what constitutes a recession, and this may make for potentially interesting discussions or heated emotional arguments but, no matter what is occurring in the media, the fact remains that the National Bureau of Economic Research (NBER) is the official organization that determines when a recession starts and ends. The NBER is a non-partisan, private non-profit (not a government agency). Based on the economic data that it monitors, as of 3/31/24, the US is not in a recession and was not showing signs of entering one. That helps us understand the base we start from before any of the tariff taxes were implemented. Ultimately, if the additional tariff taxes are implemented and maintained, the US may well enter a recession. That depends on what tariff strategy is ultimately adopted.
Disclosures.
The data comes from multiple sources and is identified in the Observations section.
The NBER monitors six economic data series for evidence that the economy is deteriorating, in recession, improving or in expansion.
- Nonfarm Payrolls
- Employment
- Industrial Production
- Real Manufacturing and Trade Industries Sales
- Real Personal Income, Excluding Transfer Payments
- Real Personal Consumption Expenditures
Observations.
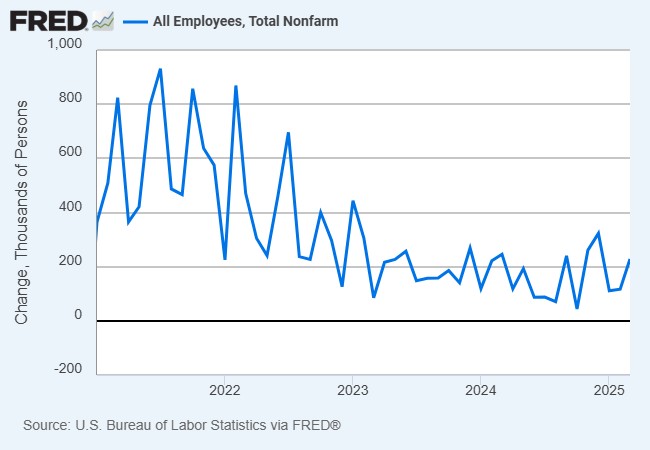
Let us start by examining what is happening with the year-over-year change in nonfarm payrolls as reported by the Bureau of Labor Statistics as of 3/31/25.
Change in Nonfarm Payrolls-
After slowing from the rapid growth in 2021 and 2022, jobs growth has remained steady within a range since 2023.
-
Nonfarm payrolls are not showing signs of significant deterioration at this time.
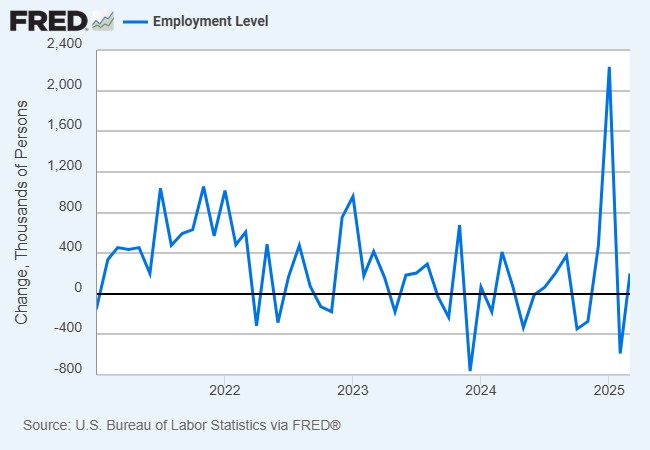
Employment data is also reported by the Bureau of Labor Statistics and the data is as of 3/31/25.
Change in Employment-
Monthly employment growth has been volatile with no clear direction.
-
Employment does not show evidence of a recession developing.
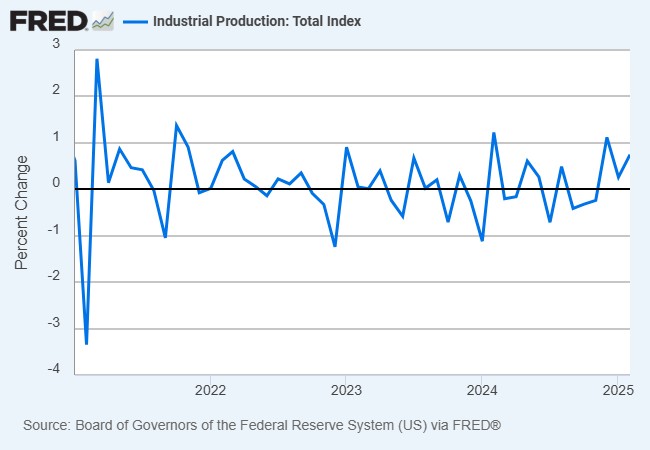
The Federal Reserve reports on Industrial Production and the most recent data is as of 2/28/25.
Change in Industrial Production-
Manufacturing struggled between 2023 and 2024 as evidenced by Industrial Production, fluctuating between positive and negative growth.
-
Similar to the Employment data, the Industrial Production data moved into positive territory at the end of 2024 and remained positive in 2025.
- The Industrial Production data does not show evidence of a recession developing.
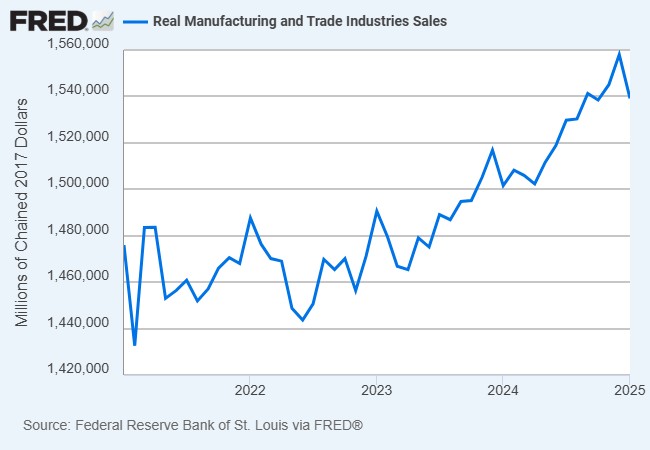
The Federal Reserve also reports on the Manufacturing & Trade Industries Sales. The most recent data is as of 1/31/25.
Change in Manufacturing & Trade Industries Sales-
The Manufacturing & Trade Industries Sales data has been in a rising trend since the middle of 2022. Even though January's data showed slowing, the rising trend is still in place.
-
Real Manufacturing & Trade Industries Sales does not show evidence of a recession developing.
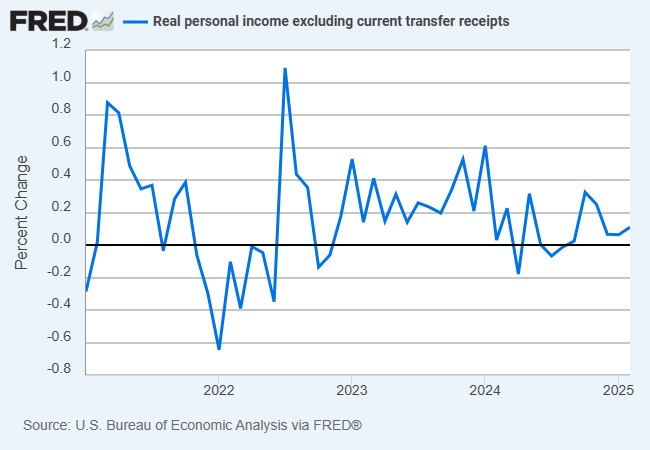
The Bureau of Economic Analysis reports on the Real Personal Income Excluding Transfer Payments data. The most recent data is as of 2/28/25.
Real Personal Income Excluding Transfer Payments-
The pace of growth in the Real Personal Income Excluding Transfer Payments data slowed after the surge in the 4th quarter of last year.
- Transfer payments that are excluded are:
- Social Security
- Medicare and Medicaid
- Unemployment insurance
- Welfare (Temporary Assistance for Needy Families)
- Disability payments (e.g., SSDI)
- Veterans' benefits
- Food stamps (SNAP)
- The NBER excludes income from transfer payments in order to focus on income that is being earned through participation in the economy.
- Transfer payments that are excluded are:
-
The Personal Income Excluding Transfer Payment data does not show evidence of a recession developing.
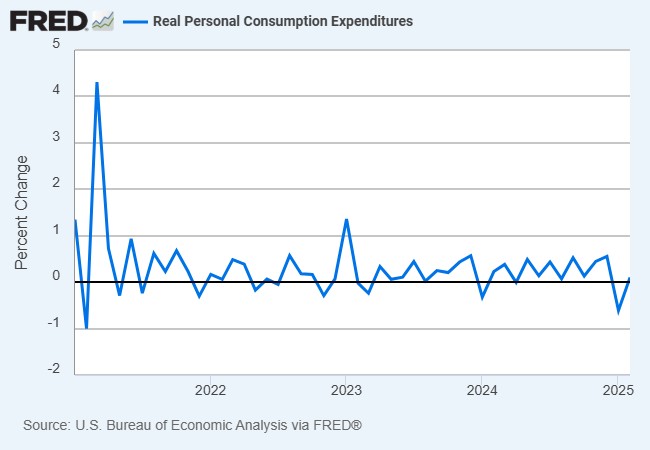
The Bureau of Economic Analysis also provides the Real Persona Consumption Expenditures data. The most recent data is as of 2/28/25.
Change in Real Personal Consumption Expenditures-
Monthly growth in the Real Personal Spending data has been volatile with brief bouts of one-month negative growth occurring throughout the time being measured.
-
Monthly growth dipped negatively again in January of this year but moved back into positive territory in February.
-
-
The Real Personal Consumption Expenditures data is trendless and does not show evidence of a recession developing.
Closing thoughts.
- Based on the official economic data that the NBER monitors, the economy was not heading towards a recession in the 1st quarter.
-
We will not have all of the March data reported until the end of April and we will not see the estimates of the two official measures of economic growth until May.
-
Real Gross Domestic Product and Real Gross Domestic Income are the two official measures of economic growth.
-
-
- Even though you may have been taught that two consecutive quarters of economic growth define a recession, that is not true. The NBER determines when a recession occurs, and its criteria are not formula based. or a single data point.
-
The criteria that the NBER uses when examining the economic data (in aggregate) to determine when a recession occurs are the following:
- Depth: How large is the decline for the data?
- Diffusion: Is the decline widespread across the data sets?
- Duration: How long has the decline been maintained?
-
The two consecutive quarters of negative economic growth are only one third of the criteria that need to be met.
-
-
The 1st quarter GDP report may give us an example of how negative growth may occur but not meet the criteria of depth, diffusion, and duration to start the clock ticking for a recession.
-
Because there was a surge in imports in the first quarter (most likely stock piling in advance of the tariff tax), and imports subtract from GDP growth, we may see negative growth in the first quarter. Since the decline is primarily isolated in the impact of the surge in imports, the NBER will most likely not view that the recession clock has started.
-
-
-
As has been discussed in the past, recessions are not homogenous throughout the US.
-
Even when an official recession is declared, not all states may be in recession.
-
Some individuals and businesses may be experiencing their own personal recessions already. This may be true for low wage earners and some small business owners.
-
-
The reason we should care about the official data is because understanding what is happening with the official data that the NBER monitors helps us understand potential responses from monetary policy (Federal Reserve) and fiscal policy (Administration and Congress).
Economic data.
|
Economic Data |
Time Period Being Reported |
Currents Results |
Previous Results |
Comments |
|
4/7/25 |
|
|
||
|
No data reported |
|
|
||
|
4/8/25 |
|
|
||
|
NFIB Small Business Optimism Index |
March |
97.4 |
100.7 |
Seven out of the ten subindices fell, two rose and one was unchanged. |
|
4/9/25 |
|
|
||
|
MBA Mortgage Applications Weekly Change |
4/4/25 |
+20.0% |
-1.6% |
The spring buying season, combined with a drop in rates, triggered a surge in applications. |
|
4/4/25 |
+9.1% |
+1.5% |
Housing inventory has recently risen, and this appears to have triggered more buying. |
|
4/4/25 |
+35.1% |
-5.6% |
People desiring to refinance their mortgage appeared to view the current drop in interest rates as temporary and rushed to refinance. |
|
4/4/25 |
6.61% |
6.70% |
Although the decline in interest rates was less than .10% by the end of the week, during the week the rate fell further. |
|
4/10/25 |
|
|
||
|
Initial Jobless Claims Weekly Change |
4/5/25 |
223,000 |
219,000 |
Even with the government layoffs, overall initial claims remained range bound. |
|
Continuing Jobless Claims Weekly Change |
3/29/25 |
1,850,000 |
1,893,000 |
Continuing claims fell by 43,000. |
|
Consumer Price Index (CPI) Year-Over-Year Change |
March |
+2.4% |
+2.8% |
A decline in energy prices drove the slow pace of growth. |
|
March |
+2.8% |
+3.1% |
Slowing price increases for both new and used motor vehicles were the primary reason for the slower growth in March. |
|
4/11/25 |
|
|
||
|
Producer Price Index (PPI) Year-Over-Year Change |
March |
+2.7% |
+3.2% |
Once again, falling energy prices drove the slower pace of growth. |
|
March |
+3.3% |
+3.4% |
Core prices did not change much from February. |
|
University of Michigan Consumer Sentiment Index |
April |
50.8 |
57.0 |
Consumer sentiment fell again in April led by a major decline in their outlook for the future. |
|
April |
56.5 |
63.8 |
Consumers became even more pessimistic about their current conditions. |
|
April |
47.2 |
57.0 |
All of the noise over tariffs and a potential recession made consumers even more pessimistic about the future. |

Steve is the Economist for Washington Trust Bank and holds a Chartered Financial Analyst® designation with over 40 years of economic and financial markets experience.
Throughout the Pacific Northwest, Steve is a well-known speaker on the economic conditions and the world financial markets. He also actively participates on committees within the bank to help design strategies and policies related to bank-owned investments.