


During March we gained perspective from the Census Bureau's Business Trends and Outlook Survey (BTOS) on the current state and future expectations of various components for small businesses. We examined current state and future expectations for business performance, revenues/receipts, and price paid and received. This week wraps up the series by examining the current state and future expectations towards paid employees. This week will examine current changes to the number of paid employees and hours worked as well as expectations for the same two categories in six months. The BTOS was updated since this series began so today's analysis has another month's data (data through 3/9/25 versus 2/9/25).
Soundbite.
Overall, small business owners are maintaining the status quo as it relates to paid employees and hours worked as the Unchanged category has the dominant percentage of responses. A couple of interesting trends are the following.
-
The bigger the company size the higher the percentage of Increased responses.
-
The smaller the company the higher the percentage of Unchanged responses.
The outlook for the future is more positive as the percentage expecting more paid employees and more hours worked is higher than current state responses.
Keep in mind that this survey was taken before this week's tariff tax announcements by the Administration. It will be interesting to see what the responses are in three months. Stay tuned.
Disclosures.
-
The data is from the Census BTOS report.
-
Data is as of 3/9/25.
-
Business sizes used are:
-
1-4 employees.
-
5-9 employees.
-
10-19 employees.
-
20-49 employees.
-
50-99 employees.
-
-
The BTOS survey has been updated with another month of data so, the time periods being examined are:
-
9/10/23
-
3/10/24
-
12/29/24
-
3/9/25
-
Observations.
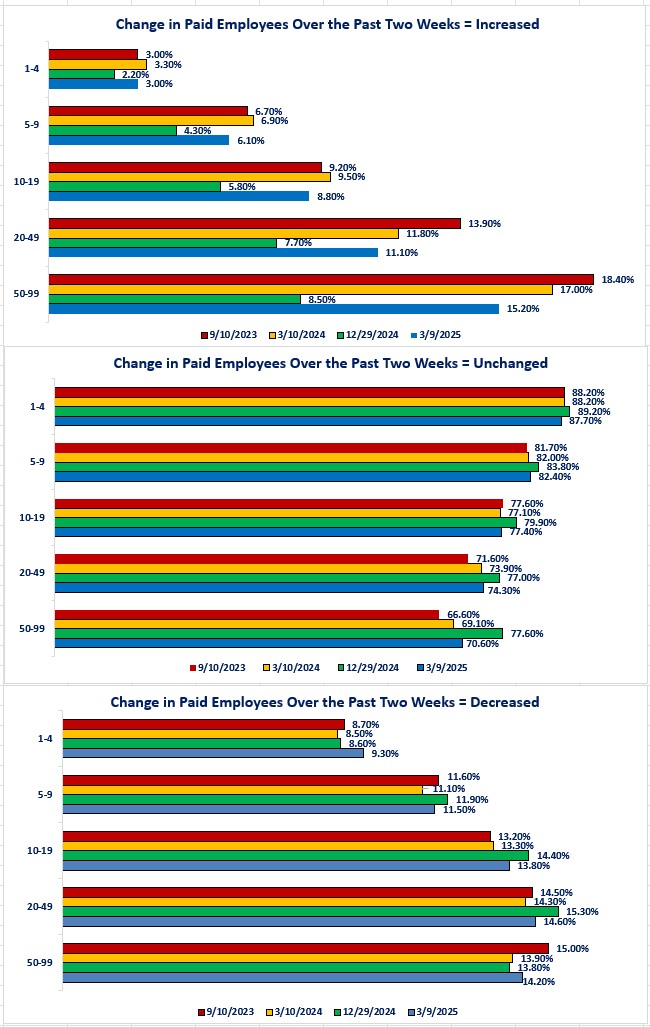
Let us start by examining changes in the number of paid employees.
The question asked was:
“In the last two weeks, how did this business's number of paid employees change?”
Current Change in the Number of Paid Employees-
For all business sizes, the percentage of business owners reporting an increase in the number of paid employees increased compared to 12/29/24 but the percentages are all below the levels at the start of the survey (9/10/23).
-
The bigger the business size, the higher the percentage of business owners reporting an increase in the number of paid employees.
-
The smaller the business size, the higher the percentage of business owners reporting no change in the number of paid employees.
-
Interestingly, the bigger the business size, the higher the percentage of business owners reporting a decrease in the number of paid employees.
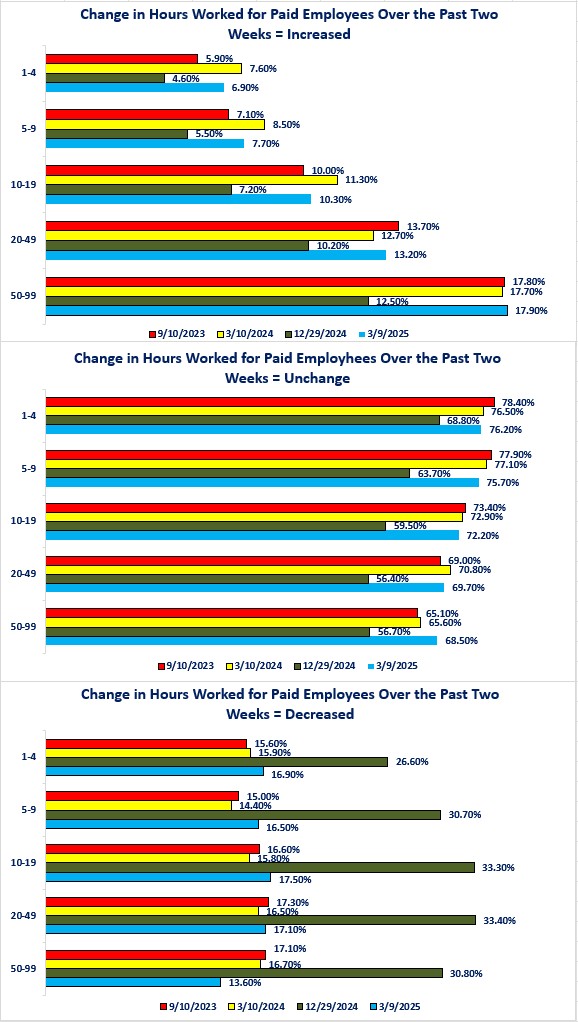
Now, let us examine what has happened with the hours worked by the paid employees.
Current Change in the Hours Worked by Paid EmployeesThe question posed was:
“In the last two weeks, how did the total number of hours worked by this business's paid employees change?”
-
The percentage of businesses that experienced increased hours worked by paid employees increased for all business sizes compared to 12/29/24.
-
It would be logical that if you increased the number of employees, the number of hours worked would increase.
-
This was not a one-for-one relationship as the percentages are different for the increase in the number of employees versus the number of hours worked.
-
The Census Bureau does not provide specifics, but the variance between number of employees and number of hours worked indicates that the measurement is for hours worked per employee.
-
-
The same pattern existed for the number of hours worked as paid employees. The bigger the business size, the higher the percentage of business owners reporting an increase in the number of hours worked by their paid employees.
-
The same is true for the hours worked as it was for paid employees when it comes to no change. The smaller the business size, the higher the percentage of business owners reporting no change in the number of hours worked.
-
The surge in the percentage of business owners reporting a decrease in hours worked as of 12/29/24 appears to be an anomaly.
-
No explanation was provided for the one-time surge but, perhaps this was tied to the end of the holiday season.
-
Whatever the reason, it was not the start of an increasing trend as the next survey period saw the percentages drop back to the ranges that existed before the surge.
-
Expected Change in Paid Employees
Next, let us examine what small business owners expect in six months.
The question asked was:
“Six months from now, how do you think this business's number of paid employees will have changed?”
-
A far higher percentage of small business owners expected to increase the number of paid employees compared to what they have currently done.
-
Once again, the bigger the business size, the higher the percentage of business owners expecting to increase the number of paid employees.
-
The gap is significant as 33.10% percent of business owners with 50-99 employees expect to increase the number of paid employees while only 9.70% of business owners with 1-4 employees expect to increase the number of paid employees.
-
-
The pattern remains that the smaller the business size, the higher the percentage of business owners expecting no change.
-
The smallest business size had the lowest percentage of business owners expecting to reduce the number of paid employees. Business owners, with 20-49 employees, had the highest percentage expecting to decrease the number of paid employees.
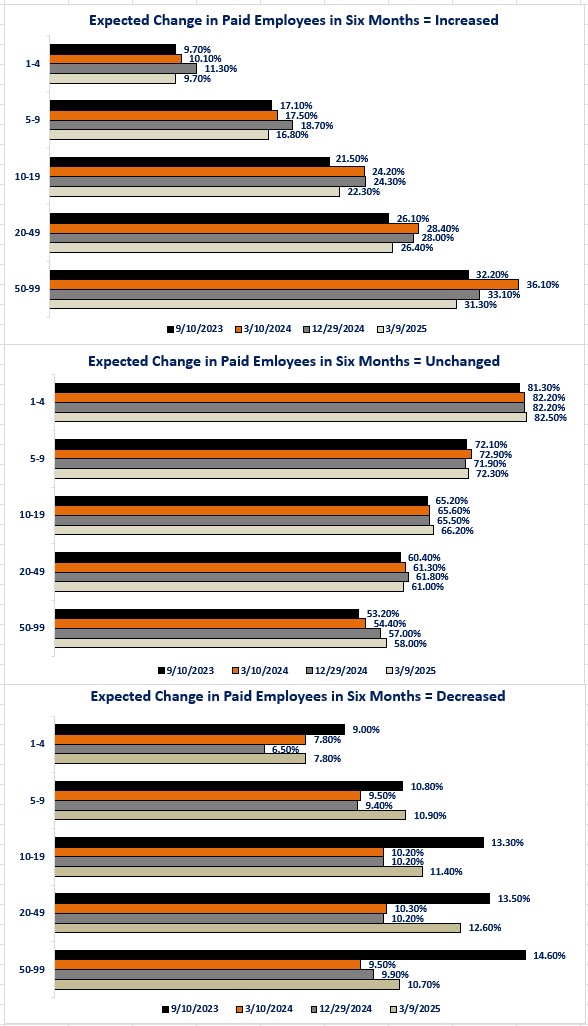
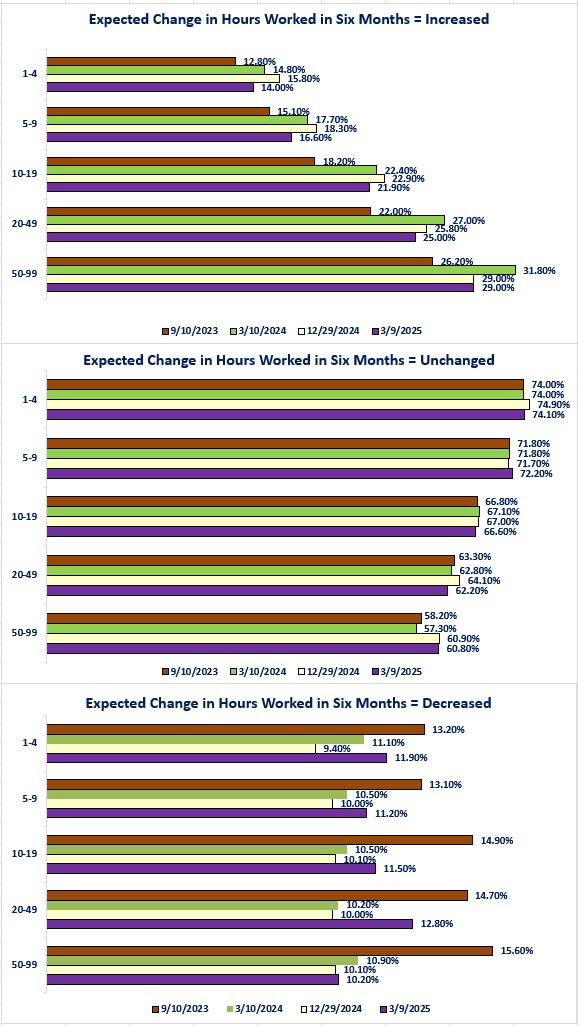
Expected Change in Hours Worked by Paid Employees
Finally, let us examine expectations for hours worked in six months.
"“Six months from now, how do you think the total number of hours worked by this business's paid employees will have changed?”
-
Not to sound like a broken record, but the percentage of business owners expecting to increase the number of hours worked by paid employees rises as business size rises.
-
The smaller the business size, the larger the percentage expecting no changes to the number of hours worked by paid employees.
-
Businesses, with 20-49 paid employees, had the highest percentage of business owners expecting to decrease hours six months from now. Businesses with 50-99 employees had the lowest percentage of business owners expecting to decrease hours worked six months from now.
Closing thoughts.
- The pattern for the number of employees and number of hours worked is like the other categories that were examined in March.
- The dominant response was in the Unchanged category.
-
This indicates that small business owners are staying with the status quo for now.
-
It is encouraging to see a higher percentage of small business owners expecting to increase the number of paid employees and the number of hours worked over the next six months.
-
Of course, this was before the new round of tariff taxes were announced.
-
-
The question remains as to how small business owners (less than 100 employees) will be impacted by the tariff tax.
-
Based on data from the U.S. Census Bureau, among all the U.S. firms identified as exporters, 91.4% had less than 100 employees, while 91.3% of importing firms had less than 100 employees.
-
This indicates that the percentage of small businesses engaged in importing and exporting is nearly identical.
-
The caveat is the data does not identify whether there are more small businesses that import or export. It strictly identifies the percentage.
-
A simplistic example to highlight the problem:
-
If there were 11 firms in the US that export and 10 of those firms had less than 100 employees, that would mean 91% of importers were businesses with less than 100 employees.
-
If there were 110 firms in the US that imported and 100 were businesses with less than 100 employees that would also mean 91% of importers were small Even though the percentages are the same, the number of businesses is different.
-
In the simple example above, that would mean more small businesses would be hurt by a tariff tax on imports than businesses that export would be hurt if the foreign trading partners imposed tariffs on their products.
-
-
-
It will be interesting to see if the BTOS report shows any new pattern developing that might indicate the impact of tariff taxes. Stay tuned.
-
Economic data.
|
Economic Data |
Time Period Being Reported |
Current Results |
Previous Results |
Comments |
|
3/31/25 |
|
|
||
|
Chicago Federal Reserve Purchasing Managers Index (PMI) |
March |
47.6 |
45.5 |
Activity picked up in March as the weather normalized. |
|
Dallas Federal Reserve Manufacturing Index |
March |
-16.3 |
-8.3 |
Activity deteriorated further in March. |
|
4/1/25 |
|
|
||
|
S&P-Global Manufacturing Activity Index |
March |
50.2 |
52.7 |
Activity slowed but remained above the neutral level of 50.0 |
|
ISM Manufacturing Activity Index |
March |
49.0 |
50.3 |
Activity slipped back into contraction territory (below 50.0) |
|
Constructions Spending Monthly Change |
February |
+0.7% |
-0.5% |
Construction activity picked up as winter weather improved. |
|
Job Openings and Labor Turnover Survey (JOLTS) |
February |
7,568,000 |
7,752,000 |
The number of job openings declined in February. |
|
IBD/TIPP Economic Optimism Index |
April |
49.1 |
49.8 |
Investor optimism continues to decline. |
|
4/2/25 |
|
|
||
|
MBA Mortgage Applications Weekly Change |
3/28/25 |
-1.6% |
-2.0% |
Mortgage applications fell for a third consecutive week. The decline was all due to a decline in refinancing activity. |
|
3/28/25 |
+1.5% |
+.01% |
New purchase activity increased last week after no change the week before. |
|
3/28/25 |
-5.6% |
-5.3% |
Refinancing activity continued to decline as stable mortgage rates provided no incentive to refinance. |
|
3/28/25 |
6.70% |
6.71% |
Mortgage rates were unchanged. |
|
ADP Nonfarm Payroll Monthly Change |
March |
+155,000 |
+84,000 |
Jobs growth almost doubled compared to February. |
|
Total Vehicle Sales |
March |
17,777,000 |
16,000,000 |
Perhaps people were rushing to buy a new car before the proposed tariffs go into effect. |
|
Factory Orders Monthly Change |
February |
+0.6% |
+1.3% |
Orders slowed in February. |
|
February |
+0.4% |
+0.3% |
Excluding transportation orders, factory orders rose slightly in February. |
|
4/3/25 |
|
|
||
|
Initial Jobless Claims Weekly Change |
3/29/25 |
219,000 |
224,000 |
Initial claims fell 6,000 compared to the previous week. |
|
Continuing Jobless Claims Weekly Change |
3/21/25 |
1,903,000 |
1,857,000 |
Continuing claims rose 56,000 |
|
Challenger Announced Layoffs Year-Over-Year Change |
March |
+204.8% |
+103.2% |
The year-over-year pace of announced layoffs almost doubled compared to February. |
|
Trade Balance |
February |
+$122.7 Billion |
-$130.7 Billion |
Solid growth in exports and no growth in imports helped narrow the trade deficit. |
|
February |
+$278.5 Billon |
+$269.8 Billion |
Exports grew by $8.7 billion in February compared to January. |
|
February |
-$401.1 Billion |
-401.2 Billion |
After a surge in imports in January, February's growth was essentially unchanged. |
|
S&P-Global Services PMI |
March |
52.5 |
50.5 |
Activity in the service sector improved. |
|
ISM Non-Manufacturing PMI |
March |
55.9 |
54.4 |
Same story for the ISM version of PMI> |
|
4/4/25 |
|
|
||
|
Bureau of Labor Statistics (BLS) Nonfarm Payrolls Monthly Change |
March |
228,000 |
+125,00 |
Despite the noise, uncertainty, and worry over fiscal policy, the economy continues to add jobs. |
|
Average Weekly Earnings Year-Over-Year Change |
March |
+3.2% |
+3.7% |
The pace of wage growth slowed as more low paying jobs were added versus high paying jobs. |
|
Labor Force Participation Rate |
March |
62.5% |
62.4% |
The rate grew slightly in March. |
|
Unemployment Rate |
March |
4.2% |
4.1% |
The rate rose as the labor force grew faster than the number of people employed. |
|
Underemployment Rate |
March |
7.9% |
8.0% |
The broadest measure of unemployment/underemployment fell slightly. |

Steve is the Economist for Washington Trust Bank and holds a Chartered Financial Analyst® designation with over 40 years of economic and financial markets experience.
Throughout the Pacific Northwest, Steve is a well-known speaker on the economic conditions and the world financial markets. He also actively participates on committees within the bank to help design strategies and policies related to bank-owned investments.