Perspectives.
It’s been a little while since we’ve focused on the regional economies, so we felt that it was worth revisiting them in an effort to provide you with a renewed baseline for 2025.
For this week’s Economic Perspectives, I will provide you with an updated economic snapshot for each of the three states Washington Trust Bank has a presence in — Idaho, Oregon, and Washington. The data I am sharing with you is updated as of 01/31/25.
In this week's Perspectives I will cover:
- Regional Jobs Growth
- Regional Jobs Growth by Industry
- Regional Wage Growth
- Regional Affordability
Soundbite.
When assessing the economies within our regional footprint, location matters as does the eye of the beholder (business owner or individual).
Through the lens of an employer, lower wages continue to make Idaho an attractive place to run a business. The opposite holds true if you are an individual looking for work, as both Oregon and Washington are arguably more attractive places to be an employee from a wage standpoint.
Regardless of this dichotomy, one observation that we’ve shared in the past still holds true. No matter where one lives within our regional footprint, affordability (especially housing) continues to be an issue.
Disclosures.
The data contained within is from:
- Bureau of Labor Statistics (BLS) report as of 01/31/25
- Zillow as of 01/31/25
Observations.
With the acknowledgment that consumer spending still accounts for 2/3rds of GDP, we will begin with jobs as they create income, which is the fuel the consumer uses to spend.
What does the labor picture look like within our regional footprint?
Jobs growth is currently strongest in Idaho and Washington where jobs are growing at a rate of 2.8% and 1.8% respectively, vs. the US at 1.3%. Oregon continues to be a laggard, trailing the national average with jobs growth of only 1.1%.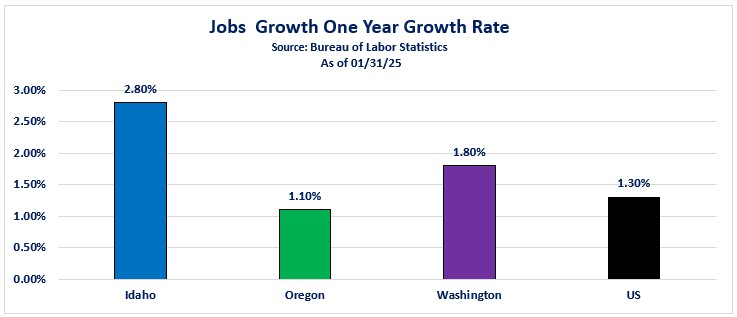
Jobs growth is just one way of measuring the health of the labor market. Another important way to measure it is by looking at jobs growth by industry. With the acknowledgment that some industries generally pay better than others, an understanding of what types of jobs are being added or lost helps to provide a picture about the consumer’s ability to spend.
Through this lens, the first observation is that the majority of jobs being created in both Oregon and Washington are concentrated in a single industry — Education and Healthcare. We’re highlighting this for an important reason: jobs within this industry arguably do not pay as well as jobs in other industries. Through January and outside of the growth in Education and Healthcare, each state has other noteworthy takeaways. Of mention is that Idaho is a standout with strong jobs growth across most industries.
Idaho is also seeing significant jobs growth in Construction as well as Mining & Logging, both of which are known for offering higher salaries. At the same time, both Oregon and Washington lost jobs in Manufacturing.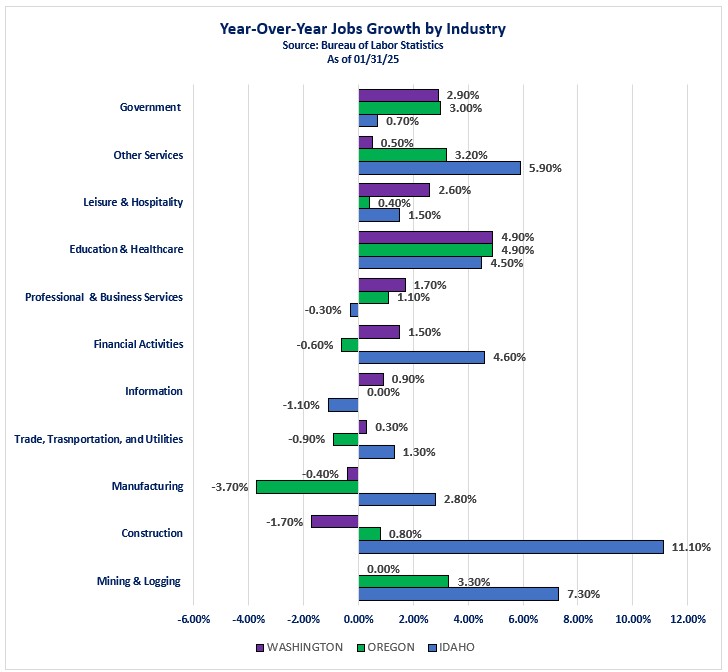
Jobs growth by industry still only tells part of the story. Yet another way to look at labor is by the number of jobs within each industry.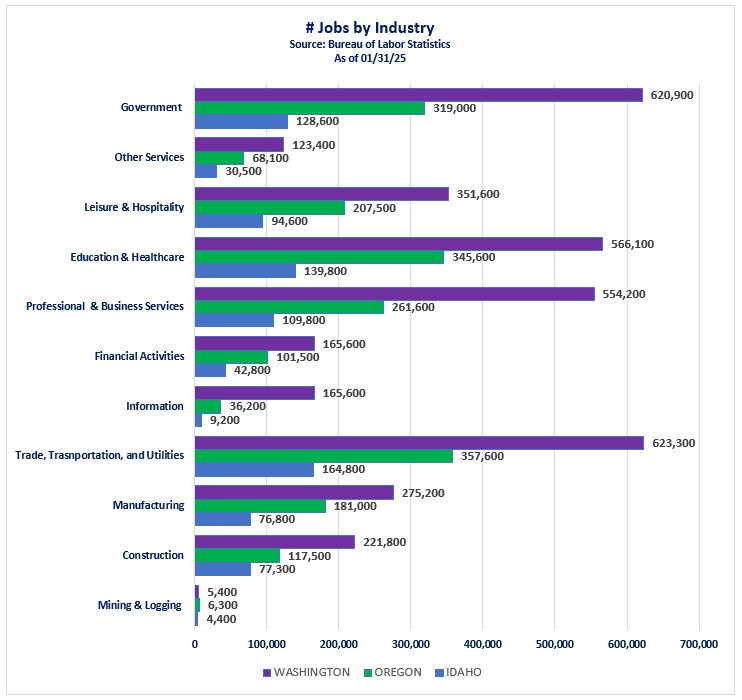
When we look at it this way, a few interesting observations arise:
Across Idaho, Oregon, and Washington the top three industries in terms of number of jobs are the same. Notably, two of these three industries also typically don’t pay as well as others, such as Information, Financial Activities, Manufacturing and Construction.
Top Three Industries
- Trade, Transportation and Utilities
- Government
- Education and Health Care
The same is generally true for the bottom four industries in each state. Notably, Mining and Logging, Information and Financial Activities are all typically attractive industries from a wage perspective but with a far smaller number of jobs.
Bottom Four Industries
- Mining and Logging
- Other Services
- Information
- Financial Services
Now that you have a good understanding of where the jobs are and where they are growing within each state, let’s look at wages.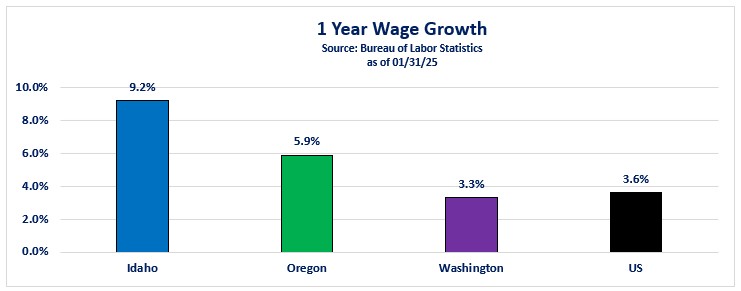
Just like with jobs growth, wage growth in Idaho is strong. Currently, both Idaho and Oregon are seeing stronger wage growth than the nation as a whole. Washington, however, is currently lagging the national average.
Like the labor market, wage growth doesn’t tell the entire story, though. When we look at average monthly wages, Idaho is far from the top. In fact, average monthly wages in Idaho trail the national average. Monthly wages are strongest in Washington and significantly outpace the national average.
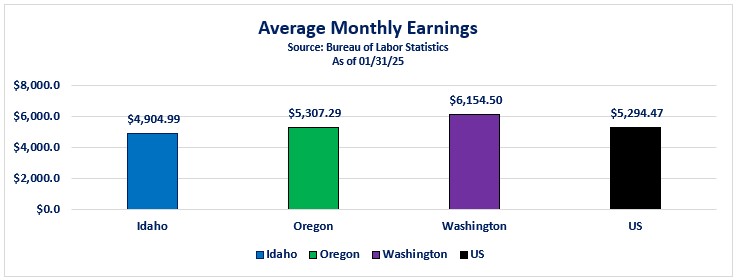
Considering everything I’ve shared with you already, if you’re an employer, Idaho would appear to be a very attractive place to operate a business. However, if you’re an individual, Oregon and Washington appear to be far more attractive as far as wages are concerned.
Through the lens of an individual looking for opportunity, they may be initially drawn to states with higher wages. Then the question becomes: what might it cost to live in each of these areas? To give you an idea, we thought it appropriate to look at housing as it’s typically the most significant expense for individuals.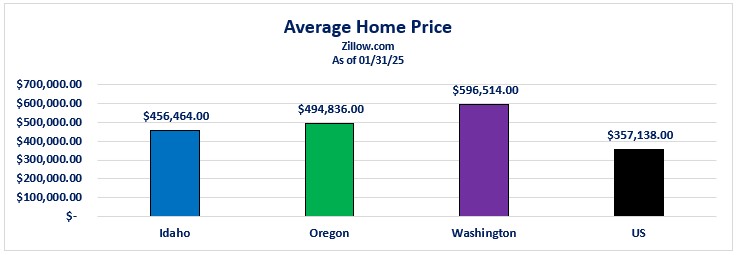
The average home price in each state exceeds the national average by a fair margin, with Washington holding first place at $596,514. If we consider the average price of a home as well as the average monthly wage in each state, we are able to get a feeling for affordability. Assuming a down payment of 10% and a 30-year mortgage rate of 6.83% (as of 01/31/25), we are able to arrive at a hypothetical loan amount, monthly payment and more importantly, a ratio of the mortgage payment as a percentage of monthly wages (higher is worse).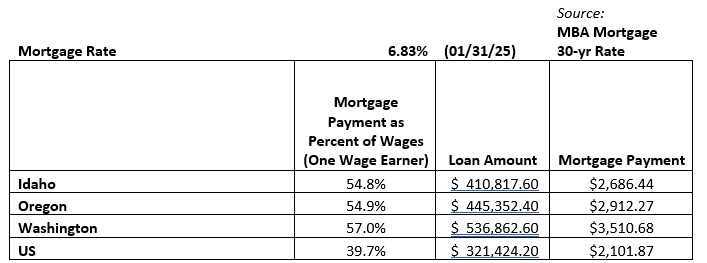
Most mortgage lenders require a debt-to-income ratio of 35% or less (some will go as high as 40% with government programs). Housing affordability continues to be a national problem and is clearly highlighted within Washington Trust Bank’s footprint. Monthly housing costs in each state absorb more than 50% of a single earner’s paycheck and are far less affordable than the national average.
Closing thoughts.
- The themes about our regional footprint that we’ve identified and discussed over the past few years still appear to hold true as we move into 2025.
- From the perspective of an employer, lower wages continue to make Idaho an attractive place to run a business.
- From a wage standpoint, both Oregon and Washington are arguably more attractive places to be an employee.
- Two of the top three industries (in terms of number of jobs) within each of the three states typically do not pay as well as other industries:
- Government
- Education and Health Care
- Weaker wage growth in Oregon and Washington relative to what we are seeing in Idaho is likely due to the majority of jobs being added in Education and Healthcare.
- Regardless of where one lives (Idaho, Oregon or Washington), affordable housing remains an issue.
- This also drives home the point that it still requires two incomes to afford a home within our regional footprint.
- It also simultaneously begs the question, what happens if one’s hours are cut, or one’s job is lost?
Economic data.
|
Economic Data |
Time Period Reported |
Current Results |
Previous Results |
Comments |
|
3/24/25 |
|
|
|
|
|
Chicago Fed National Activity |
February |
0.18 |
-0.08 |
Improvement from January suggesting economic growth increased. |
|
S&P Global Composite PMI |
March |
53.5 |
51.6 |
Strongest growth since December of 2024. |
|
March |
49.8 |
52.7 |
February was stronger due to tariff front-running. |
|
March |
54.3 |
51.2 |
Better weather contributed to a strong rebound from February’s 15-month low. |
|
3/25/25 |
|
|
|
|
|
Building Permits |
February |
1.459M |
1.473M |
Approvals declined the most in multi-family. |
|
Building Permits (MoM) |
February |
-1.0% |
-0.6% |
Third consecutive month of declines. |
|
House Price Index (MoM) |
January |
0.2% |
0.5% |
Trending lower since September of 2024. |
|
House Price Index (YoY) |
January |
4.8% |
4.8% |
12-month changes were positive in all divisions. |
|
Conference Board Consumer Confidence |
March |
92.9 |
100.1 |
Fourth straight month of declines and lowest level in 12 years. |
|
New Home Sales (MoM) |
February |
1.8% |
-6.9% |
Solid rebound from January. |
|
Richmond Fed Manufacturing Index |
March |
-4 |
6 |
Majority weakness was in shipments. |
|
3/26/25 |
|
|
||
|
MBA 30-Year Mortgage Rate |
3/21/25 |
6.71% |
6.72% |
Compares with 6.93% a year ago. |
|
MBA Mortgage Applications |
3/21/25 |
-2% |
-6.2% |
Refinance activity declined while purchase activity increased. |
|
Durable Goods Orders (MoM) |
February |
0.9% |
3.3% |
Majority strength was in Transportation Equipment. |
|
3/27/25 |
|
|
||
|
Continuing Jobless Claims |
3/15/25 |
1,856K |
1,881K |
Weekly claims edged lower. |
|
Initial Jobless Claims |
3/22/25 |
224K |
225K |
Still at historically low levels. |
|
PCE Prices |
Q4 2024 |
2.4% |
1.5% |
Same as the second estimate. |
|
Core PCE Prices |
Q4 2024 |
2.60% |
2.20% |
Slightly less than the prior estimate of 2.7%. |
|
GDP QoQ |
Q4 2024 |
2.4% |
3.1% |
Slightly better than estimates of 2.3% and helped along by year-end consumer spending. |
|
Real Consumer Spending |
Q4 2024 |
4.0% |
3.7% |
Third consecutive quarter of gains. |
|
Goods Trade Balance |
February |
-147.91B |
-155.57B |
Imports surged 22.5%. |
|
Wholesale Inventories |
February |
0.3% |
0.8% |
Inventories of both durable and non-durable goods declined. |
|
Pending Home Sales (MoM) |
February |
2.0% |
-4.6% |
First increase in three months boosted by sales in the South and Midwest. |
|
3/28/25 |
|
|||
|
PCE Price Index (YoY) |
February |
2.5% |
2.5% |
Same as January and in-line with expectations. |
|
Core PCE Price Index (YOY) |
February |
2.8% |
2.7% |
Above expectations of 2.7% as tariff threats loom. |
|
Personal Income (MoM) |
February |
0.8% |
0.4% |
Employee compensation rose 0.5% and rental income by 0.9%. |
|
Personal Spending (MoM) |
February |
0.4% |
0.5% |
Spending on goods gained by $56.3bln and services by $31.5bln. |
|
Michigan 1-yr Inflation Expectations |
February |
5.0% |
4.9% |
Rose again for the fourth straight month. |
|
Michigan 5-yr Inflation Expectations |
March |
4.1% |
3.9% |
Highest since February of 1993. |
|
Michigan Consumer Expectations |
March |
52.6 |
54.2 |
Weakest reading since July of 2022. |
|
Michigan Consumer Sentiment |
March |
57.0 |
57.9 |
Consumers continue to worry about ongoing economic policy developments. |
|
Michigan Current Conditions |
March |
63.8 |
63.5 |
Lowest reading in six months. |
|
Atlanta Fed GDPNow (Q1) |
3/28/25 |
-2.8% |
-1.8% |
Forecasting further weakness than the prior release on policy uncertainty. |

Steve is the Economist for Washington Trust Bank and holds a Chartered Financial Analyst® designation with over 40 years of economic and financial markets experience.
Throughout the Pacific Northwest, Steve is a well-known speaker on the economic conditions and the world financial markets. He also actively participates on committees within the bank to help design strategies and policies related to bank-owned investments.


