


Last week's newsletter focused on how small business owners assessed their businesses' performance. This week we will examine what has happened with revenues/sales/receipts as well as current and expected changes in the demand for goods and services.
Soundbite.
Overall, the largest percentage of small business owners are reporting no change to their revenues or demand for goods and services. They are also not expecting any changes six months from now.
Size still matters, especially for those reporting a decrease in revenues and demand for goods and services as the percentage grows as the size of the business decreases.
The biggest risk for the economy is if small business owners and their employees decide to “wait and see” what will happen with new fiscal policy. Waiting means no new spending, which would slow economic growth.
Disclosures.
-
Data is from the Census Bureau's Business Trends and Outlook Survey (BTOS).
-
Data is as of 2/10/25.
-
Three time periods will be examined.
-
9/10/23 (start of survey)
-
12/31/24
-
2/9/25.
-
-
Three categories will be examined.
-
Change in revenue/sales/receipts.
-
Change in demand for goods and services.
-
Expected change in demand for goods and services six months from now.
-
Note: The Census Bureau did not survey small business owners for their expectations of changes in revenue/sales/receipts six months from now so this category will only have current conditions.
-
-
To reduce the wordiness, for the rest of this newsletter, I will use the term “revenues” to mean revenues/sales/receipts.
-
Graphs will still show the full description.
-
Observations.
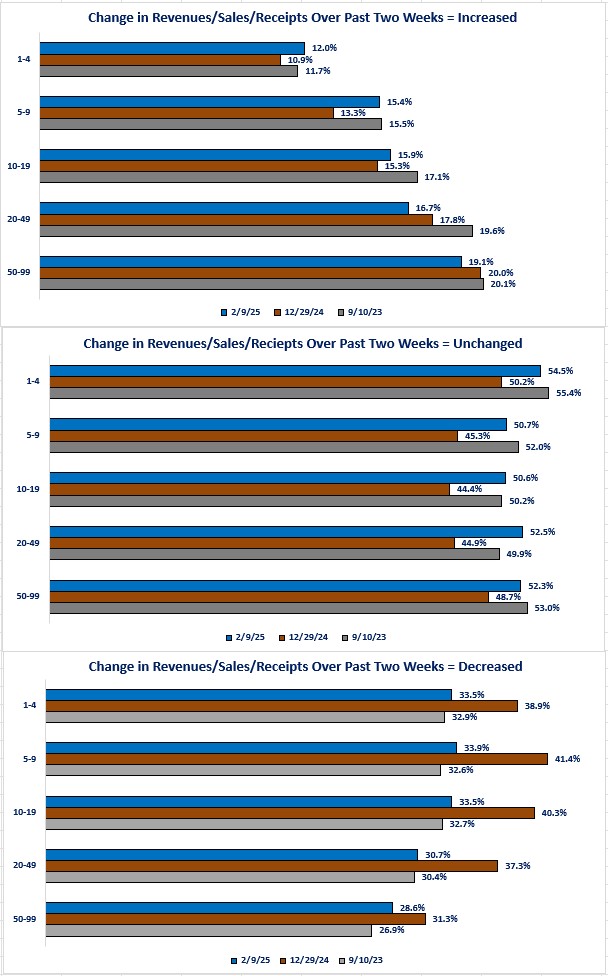
Let us start by examining what is the current situation for revenues/sales/receipts.
The question asked was: “In the last two weeks, how did this business's operating revenues/sales/receipts change?”
-
More than 50% of small business owners reported no change in their revenues over the past two weeks as of 2/9/25.
-
That percentage fell at the end of the year but has rebounded and is now close to the level that existed as of 9/10/23.
-
-
The percentage of small business owners reporting an increase showed a mixed trend compared to 9/10/23.
-
Overall, the bigger the size of the business, the higher the percentage but the three smallest size categories have a higher percentage reporting an increase compared to 9/10/23.
-
The two largest size categories have a lower percentage of owners reporting increased sales, revenues and receipts compared to 9/10/23.
-
-
-
The percentage of small business owners reporting a decline grew as the size of the business fell.
-
Businesses with 1-4 employees are at 33.5% as of 2/9/25 compared to 28.6% for businesses with 50-99 employees.
-
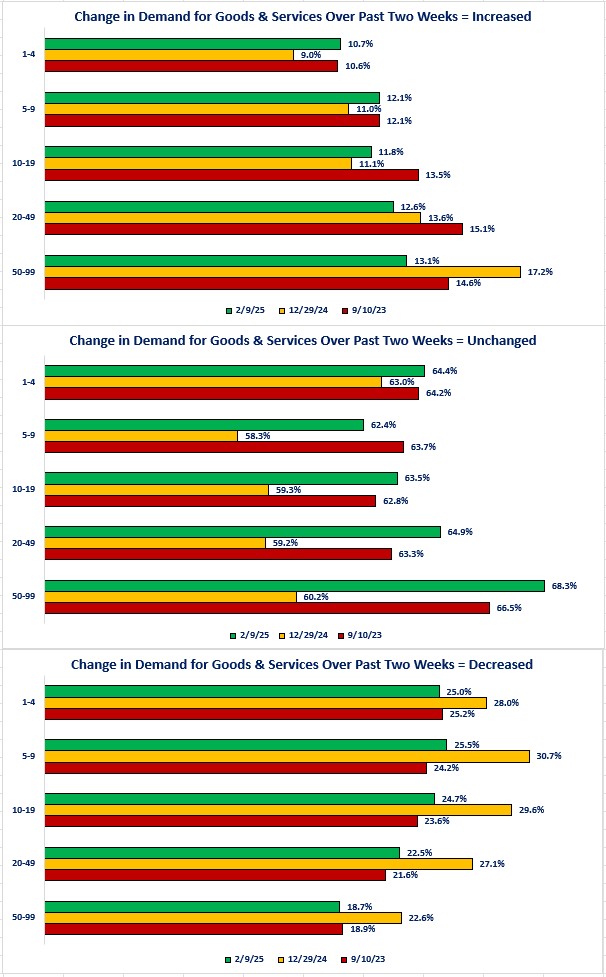
Now let us examine a category that is related to revenues: demand for goods and services. In theory, of demand is rising or falling then, all else being equal, revenue would follow with a similar trend.
The question asked was: “In the last two weeks, how did demand for this business's good or services change?”
-
An even higher percentage of small business owners reported no change to demand over the past two weeks as of 2/9/25.
-
We can observe the same pattern that existed for change in revenues as of 12/31/24, which shows the Unchanged category percentage decreasing but then rebounding as of 2/9/25.
-
-
There was a sizeable increase in the percentage of small business owners reporting a decrease in demand as of 12/31/24.
-
The percentage dropped back to percentages that are close to the levels that existed as of 9/10/23.
-
-
The trend in the percentage of small business owners reporting an increase is more mixed than the trend for revenues.
-
Businesses with 1-4 employees have a slightly higher percentage compared to 9/10/23.
-
Businesses with 5-9 employees have the same percentage as 9/10/23.
-
Businesses with 10-19, 20-49 and 50-99 employees have a lower percentage than 9/10/23.
-
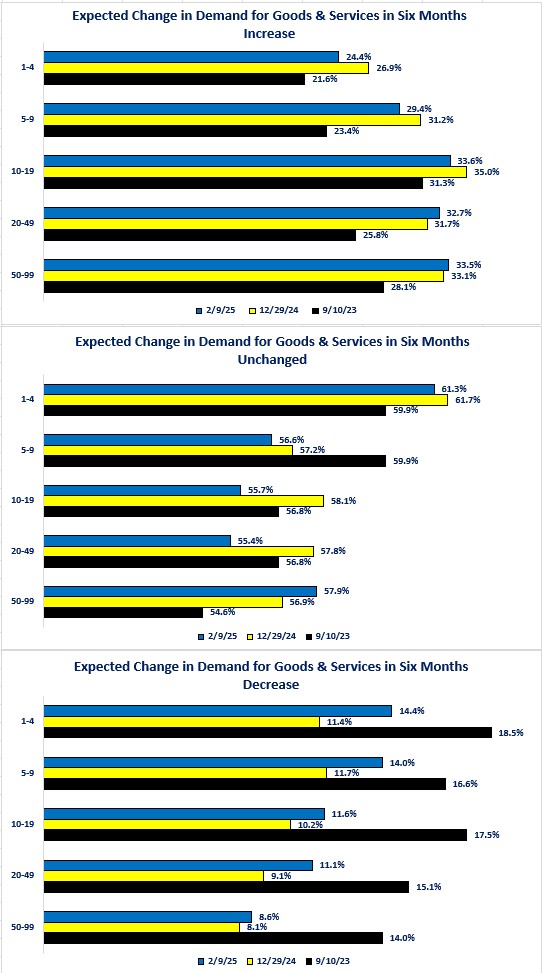
Even though the Census Bureau did not survey businesses for their outlook on revenues six months from now, we can examine their outlook for demand for goods and services.
The question asked was: “Six months from now, how do you think demand for this business's goods or services will have changed?”
-
Overall, small business owners are more optimistic and less pessimistic with the expectations for demand six months from now.
-
Even though that is a true statement, it is still the case that the largest percentage of responses was for no change.
-
The percentage ranged from a low of 55.4% to a high of 61.3% expecting no change six months from now.
-
-
-
Overall, the bigger the size of the business the higher the percentage of owners who expect increased demand six months from now.
-
Businesses with 1-4 employees had the lowest percentage at 24.4%.
-
Businesses with 10-19 employees just beat businesses with 50-99 employees for the highest percentage.
-
10-19 employees = 33.6%.
-
50-99 employees = 33.5%.
-
-
All size categories have a higher percentage expecting an increase in demand as of 2/9/25 compared to 9/10/23.
-
-
Unfortunately. the smaller the business size the higher the percentage of business owners expecting a decrease in revenues.
-
1-4 employees = 14.4%.
-
50-99 employees = 8.6%.
-
-
On a relative basis, the good news is that, for all business sizes, the percentage expecting a decrease in demand is lower than what existed as of 9/10/23.
Closing thoughts.
- Overall, the largest percentage of small business owners are reporting no change in their current revenues and demand for goods and services.
-
The survey results show that they do not expect a change six months from now.
-
-
Size still matters when examining the percentages for those currently experiencing decreases and expecting decreases in the future.
- The good news is that for all business sizes, business owners are less pessimistic about the demand for goods and services in the future as the percentage expecting a decrease is significantly lower than those currently reporting a decrease.
-
Given the relatively brief time for this survey, there is insufficient history to show us the forecasting ability of small business owners over a full economic cycle. What you expect versus what actually happens are two different things for any business.
-
One of the biggest challenges for any business is uncertainty.
-
This is especially true for a small business owner who may not have the financial resources that a big business may have to absorb unexpected shocks.
-
The risk for the economy is if small businesses and their employees decide to do nothing and wait to see what develops. Waiting means less spending which would impact economic growth.
-
-
As a side note, the National Federation of Independent Business just released the results for their Small Business Optimism Index as of 2/28/25 and the index fell compared to January.
-
One area to note is that the Uncertainty index continues to rise and is now at its second highest level ever.
-
-
The data for the BTOS data is as of 2/9/25 which was before most of the activity around new fiscal policy began.
-
It will be important to see what the responses are six months from now,
-
If any new fiscal policies (tariffs, deportation, tax cuts, de-regulation) have been put in place, their impact on small businesses should be clearer in six months.
-
Economic data.
|
Economic Data |
Time Period Reported |
Current Results |
Previous Results |
Comments |
|
3/10/25 |
|
|
|
|
|
No data releases |
|
|
|
|
|
3/11/25 |
|
|
|
|
|
NFIB Small Business Optimism Index |
February |
100.7 |
102.8 |
Eight out of the eleven sub-indices fell with the biggest decline occurring in small business owners' expectation for the economy to improve. |
|
Job Openings and Labor Turnover Report (JOLTS) |
January |
7,740,000 |
7,508,000 |
Job openings rose by 232,000 while hiring rose 19,000. People quitting their jobs rose 171,000. |
|
3/12/24 |
|
|
|
|
|
MBA Mortgage Applications Weekly Change |
2/7/25 |
+11.2% |
+20.4% |
Continued strong activity in refinancing drove the double-digit gains in total applications. |
|
2/7/25 |
+7.0% |
0.0% |
The continued decline in mortgage rates and the start of the spring selling season has brought buyers back into the market. |
|
2/7/25 |
+16.2% |
+37.0% |
Lower mortgage rates continued to propel refinancing activity. |
|
2/7/25 |
6.67% |
6.73% |
Mortgage rates are following the decline in the ten-year Treasury rate. |
|
Consumer Price Index (CPI) Monthly Change |
February |
+0.2 |
+0.5% |
Price increases moderated in February. |
|
February |
+0.2% |
+0.4% |
Core price increases also slowed. |
|
CPI Year-Over-Year Change |
February |
+2.8% |
+3.0% |
The year-over-year pace fell below 3.0%. |
|
February |
+3.1% |
+3.3% |
Although slower than in January, the pace is still above the Federal Reserve's 2.0% target. |
|
3/13/24 |
|
|
|
|
|
Initial Jobless Claims Weekly Change |
3/8/25 |
220,000 |
222,000 |
Despite Federal layoffs, initial jobless claims remain within the 200,000-250,000 range. |
|
Continuing Jobless Claims Weekly Change |
3/8/25 |
1,870,000 |
1,897,000 |
Continuing claims declined 27,000. |
|
Producer Price Index (PPI) Monthly Change |
February |
0.0% |
+0.6% |
Falling energy prices kept the headline PPI growth unchanged in February. |
|
February |
+0.2% |
+0.3% |
A drop in trade services prices resulted in slightly slower overall growth compared to January. |
|
PPI Year-Over-Year Change |
February |
+3.2% |
+3.5% |
Slower but still above 2.0% |
|
February |
+3.3% |
+3.6% |
Also slower but still above 3%. |

Steve is the Economist for Washington Trust Bank and holds a Chartered Financial Analyst® designation with over 40 years of economic and financial markets experience.
Throughout the Pacific Northwest, Steve is a well-known speaker on the economic conditions and the world financial markets. He also actively participates on committees within the bank to help design strategies and policies related to bank-owned investments.