


Last week, we gained perspective on how many businesses with 100 or less employees exist in the US. Even though small businesses themselves may not contribute a large amount to US GDP growth compared to big businesses, small businesses employ over 50% of employees in the US.
Since consumer spending makes up almost 70% of US GDP growth, those employees play a very important role in economic growth. As a result, I believe it is worthwhile to take a deeper dive into what small businesses are currently experiencing as well as expectations for the future. This week starts a five-part series that examines current conditions and future expectations of small businesses for the following categories.
-
Business performance
-
Operating revenue/sales/receipts
-
Employees
-
Prices paid and received
-
Use of Artificial Intelligence
Soundbite.
Overall, small businesses owners currently rate their businesses' performance as average as almost 50% of the responses were in the Average category. People may not like being rated average for their performance, but a small business owner may view it more like a Goldilocks result (i.e., "not too hot, not too cold").
Size matters as the smaller the number of employees the smaller the percentage of small businesses that land in the top two categories and the higher the percentage that are in the bottom two categories.
Since this is a “soft” data category (focused on how small business owners feel versus what they are actually doing), it remains to be seen how these ratings will translate to business profitability and hiring patterns.
Disclosures.
The data is from the Census Bureau's Business Trends and Outlook (BTOS) report.
-
Data is as of 2/9/25.
I am continuing to focus on businesses with 100 employees or less. Given that focus, the Census Bureau breakdown is as follows:
-
1-4 employees
-
5-9 employees
-
10-19 employees
-
20-49 employees
-
50-99 employees
Observations.
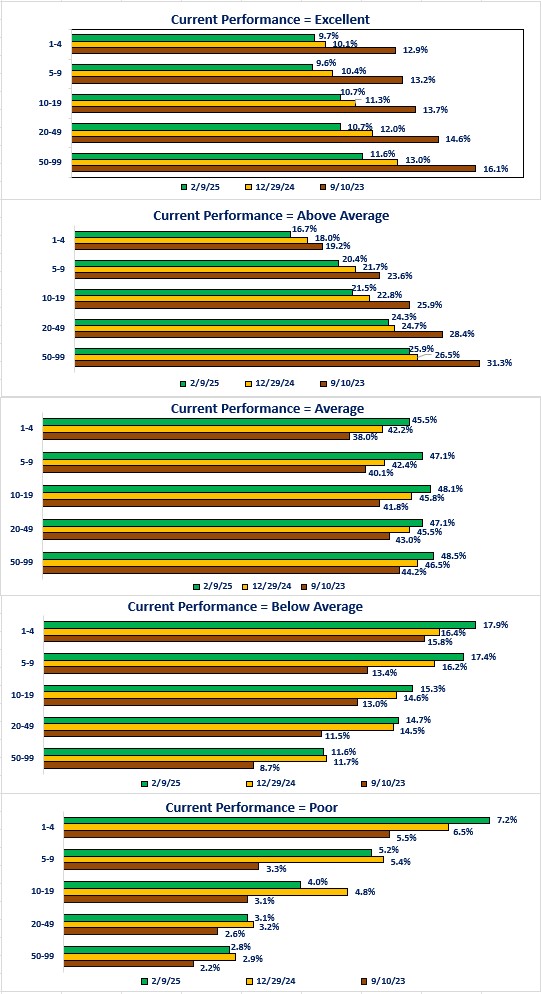
Let us start by examining what small businesses are currently experiencing. The question from the Census Bureau is: “Overall, how would you describe this business's current performance?”.
Current Performance-
Three ratings categories have seen a steady increase in their percentage of the total since the start of the survey (9/10/23).
-
Average, Below Average and Poor
-
The percentage varied by size, but the trend is true for all business sizes.
-
-
The increase in those three categories was due to a consistent decline in the top two rating categories.
-
Excellent and Above Average
-
Once again, the trend existed for all business sizes.
-
-
The highest category for percentage of total responses is the Average category.
-
Small businesses with 50-99 employees had 48.5% of owners rate their current performance as Average while businesses with 1-4 employees had 45.5% of owners rate their current performance as Average.
-
-
The good news (relatively) is that the Poor category makes up the smallest percentage of the total.
-
Small businesses with 1-4 employees had 7.2% of owners rating their current performance as Poor compared to 2.8% for small businesses with 50-99 employees.
-
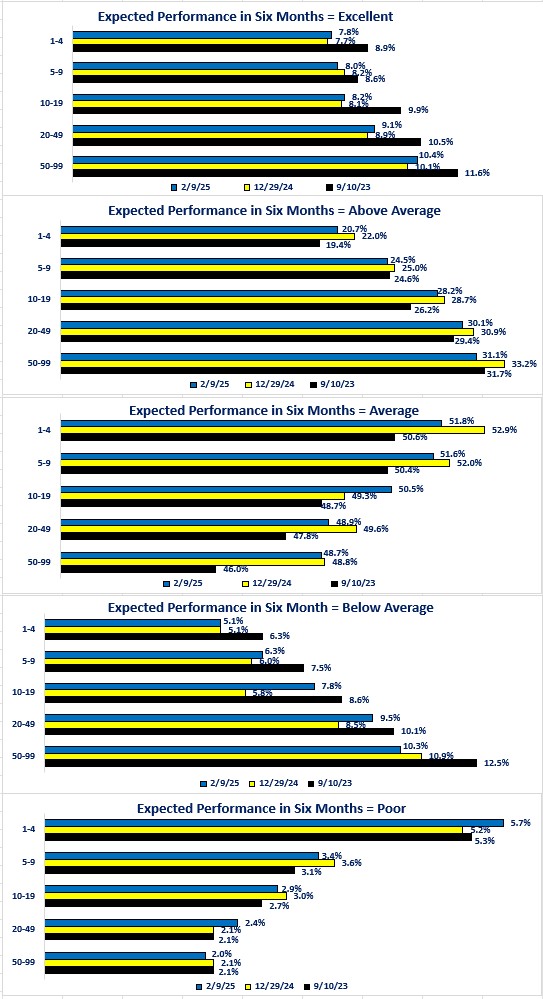
The questions posed by the BTOS survey is: “Six months from now, how do you think you will describe this business's current performance?”.
-
Three categories experienced a decrease in the percentage compared to 9/10/23. Those categories experiencing a decrease were Excellent, Above Average and Below Average.
-
The Average and Poor categories experienced increases in their percentages of the total.
-
-
The percentage of business owners expecting their performance to be average rose above 50% for three out of the five categories.
-
Small businesses with 1-4 employs had 51.8% of the responses expecting performance to be average while small businesses with 50-99 employees had 48.7%.
-
-
When comparing current conditions versus future expectations ratings, small businesses owners are not super optimistic (Excellent rating) or pessimistic (Poor rating).
-
When comparing current versus future ratings, percentage point declines occurred in the Excellent, Below Average and Poor categories while increases occurred in the Above Average and Average categories,
-
The category that experienced the biggest percentage point improvement was the Above Average category. The percentage point difference between future and current ratings ranged from 4 percentage points higher (1-4 employees) to 6.7 percentage points higher (10-19 employees).
-
Small businesses with 1-4 employees saw the biggest percentage point drop when comparing current versus future ratings. The percentage of small business owners rating current performance as Poor is 7.2%. The percentage expecting Poor performance six months from now is 5.7%.
-
-
Closing thoughts.
-
Overall, small business owners currently rate their businesses's performance as average since the Average category comprises almost 50% of the total responses for current conditions.
-
Although people may not be happy if told that their performance was average, an “average” assessment of current performance for a small business owner may have more of a Goldilocks meaning (i.e. “not too hot, not too cold").
-
-
The data highlights another example of where size matters.
- You can see a steady decline in the percentage of total for the top two ratings (Excellent and Above Average) when examining the percentages by company size from biggest (50-99) to smallest (1-4).
-
Unfortunately, you can also see a steady increase in the percentage of total for the bottom two ratings (Below Average and Poor) when examining the percentages by company size from biggest to smallest.
-
Small business owners are less optimistic when it comes to their expectations for performance six months from now.
-
The percentages for the Excellent and Above Average categories have fallen compared to 9/10/23 and the percentages are lower than the categories' current performance percentages.
-
The percentage for the Average category rises to over 50% for three of the five business sizes when assessing expectations for performance six months from now.
-
The encouraging news is that the percentage of responses for the Poor category are lower for six months from now compared to the current percentages for all business sizes.
-
-
It is important to remember that the performance category is a “soft” data point since it is essentially asking small business owners how they are feeling versus actual results.
-
Next week will examine an area that will provide both a “hard” (current) and a “soft” result (future expectations).
-
The area to be examined will be current and future expected changes to operating revenues/sales/receipts.
-
Economic data.
|
Economic Data |
Time Period Reported |
Current Results |
Previous Results |
Comments |
|
3/3/25 |
|
|
|
|
|
S&P-Global Manufacturing PMI |
February |
52.7 |
51.2 |
Manufacturing activity improved further in February. |
|
ISM Manufacturing PMI |
February |
50.3 |
50.9 |
ISM's version of manufacturing activity slipped slightly but remained positive. |
|
February |
62.4 |
54.9 |
In a concerning development, prices surged for manufacturers in February. |
|
Atlanta Federal Reserve Real-Time GDP Forecast |
1st Quarter |
-2.8% |
+2.5% |
The Atlanta Federal Reserve's model is now forecasting a decline in economic activity in the 1st Quarter. This is subject to ongoing revisions until the end of the month. |
|
3/4/25 |
|
|
|
|
|
Car Sales |
February |
2,950,000 |
2,830,000 |
Consumers are still willing to buy new cars. |
|
Truck Sales |
February |
13,05,000 |
12,670,000 |
Consumers still prefer trucks (including SUVs) over cars. |
|
3/5/25 |
|
|
|
|
|
MBA Mortgage Applications Weekly Change |
2/28/25 |
+20.4% |
-1.2% |
The surge in applications was all due to a surge in refinancing activity. |
|
2/28/25 |
0.0% |
0.0% |
Activity to purchase a house remained flat for the second week in a row. |
|
2/28/25 |
+37.0% |
-3.5% |
The decline in mortgage rates below 6.75% triggered a wave of refinancing activity. |
|
2/28/25 |
6.73% |
6.88% |
Homeowners appear to fear that the risk is for rates to rise as they rushed to refinance. |
|
ADP Nonfarm Payroll Monthly Change |
March |
77,000 |
186,000 |
The weakest results were for the smallest companies (1-19) employees who shed 17,000 jobs. The strongest results were the largest companies (500+) as they added 37,000 jobs. |
|
S&P-Global Services PMI |
February |
51.0 |
52.9 |
Activity in the US service sector slowed but remained positive. |
|
ISM Non-Manufacturing PMI |
February |
54.4 |
54.5 |
Activity was essentially unchanged in the US service sector based on ISM's index. |
|
Factory Orders Monthly Change |
January |
+1.7% |
-0.6% |
The increased pace of growth was almost all in the transportation sector. |
|
January |
+0.2% |
+0.3% |
The pace of growth, excluding transportation, slowed slightly compared to December. |
|
3/6/25 |
|
|
|
|
|
Challenger Job Cuts Year-0ver-Year Change |
February |
103.2% |
-39.5% |
Announced layoffs surged the most since 2020 with layoffs in government jobs leading the surge. |
|
Initial Jobless Claims |
3/1/25 |
221,000 |
242,000 |
Initial claims fell 21,000 last week and remain within the range of 200,000 to 250,000. |
|
Continuing Jobless Claims |
2/22/25 |
1,897,000 |
1,855,000 |
Continuing claims rose 42,000 in a sign that once people are laid off, it is taking longer to find a new job. |
|
Trade Balance |
January |
-$131.4 Billion |
-$98.1 Billion |
Increased $33.3 billion as imports surged in front of tariffs being implemented. |
|
January |
$269.8 Billion |
$266.8 Billion |
Exports increased by $3 billion. |
|
January |
$401.2 Billion |
$364.9 Billion |
Imports increased $36.3 billion as companies were front-loading inventory in front of tariffs. |
|
Nonfarm Productivity Quarter-Over-Quarter Annualized Change |
4th Quarter |
+1.5% |
+2.2% |
Productivity for the manufacturing industry rose 0.3% while non-manufacturing industries rose 2.0%. |
|
4th Quarter |
+2.2% |
+0.8% |
Unit labor costs increased significantly compared to 3rd quarter growth. |
|
3/7/25 |
|
|
|
|
|
US Nonfarm Payrolls Monthly Change |
February |
151,000 |
125,000 |
The nation continues to create jobs which creates additional income. |
|
Average Weekly Earnings Year-Over-Year Change |
February |
3.6% |
4.1% |
The pace of wage growth slowed but remained faster than the Federal Reserve desires. |
|
Labor Force Participation Rate |
February |
62.4% |
62.6% |
A decline in the number of people in the labor force resulted in the decline in the Labor Force Participation Rate. |
|
Unemployment Rate |
February |
|
4.0% |
The unemployment rate rose as the number of unemployed increased (even though the Establishment Report showed more jobs being created) |

Steve is the Economist for Washington Trust Bank and holds a Chartered Financial Analyst® designation with over 40 years of economic and financial markets experience.
Throughout the Pacific Northwest, Steve is a well-known speaker on the economic conditions and the world financial markets. He also actively participates on committees within the bank to help design strategies and policies related to bank-owned investments.