


I have often made the statement that small businesses are the life blood of the economy since all cities and towns have small businesses while few have S&P 500 large businesses. This week's Perspective section examines small businesses versus small mid-sized, mid-sized, and large businesses.
Soundbite.
Large businesses may get the headlines and drive stock prices but most businesses in the US are small businesses. Overall, small businesses still have more than 50% of the employees too.
With all of the noise, fear, uncertainty and change that currently exists regarding the strategies and policies of the new administration, the one message that remains critical for all communities and citizens to communicate to their elected representatives is: “Remember the small businesses and the impact on them when considering policies and legislation.”
Disclosures.
The data is pulled from the Census Bureau's County Business Patterns program.
- This data was released by the Census Bureau in December 2024.
- This data is older than most data that I try to use since it is as of 2022 with the most recent update as of 12/31/24.
Even though many people will classify a “small” business as any business with less than 500 employees, the Census Bureau does break down its categories into finer detail. As a result I have arbitrarily broken down the business categories a little differently to highlight something closer to a true small “Mainstreet” business. The categories that will be used in this week's analysis are:
- Small business = 1-99 employees
- Small Mid-size business = 100-499 employees
- Mid-Size business = 500-999 employees
- Large business = 1,000 employees or more
- Note: The Census Bureau does not break down larger establishments beyond the 1,000 or more category.
The data will be examined from five perspectives:
- Employees and businesses as a percentage of business size.
- Types of businesses as a percentage of total businesses.
- Percentage of employees and businesses by business type.
- Percentage of total employees by industry sector.
Observations.
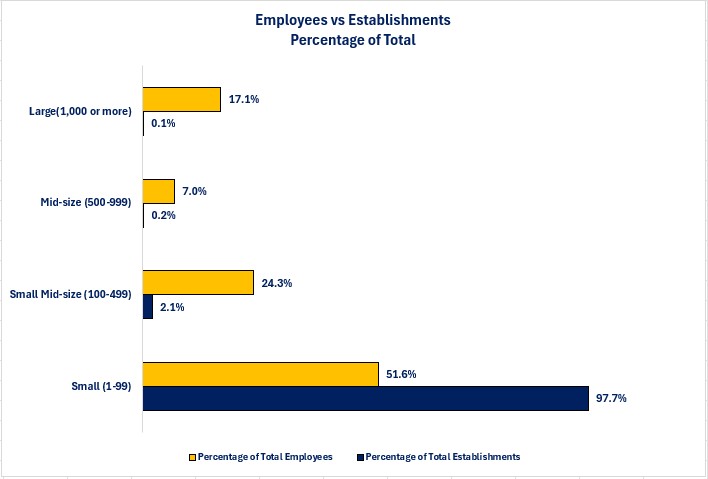
Let us start the analysis by examining the percentage of businesses that exist by the four size categories and the percentage of employees that work in each size category.
Employees Versus Businesses as a Percentage of Business Size- The overwhelming percentage of businesses fall into the Small category.
- The percentage is not as large for employees, but small businesses still employ over 50% of the total employees.
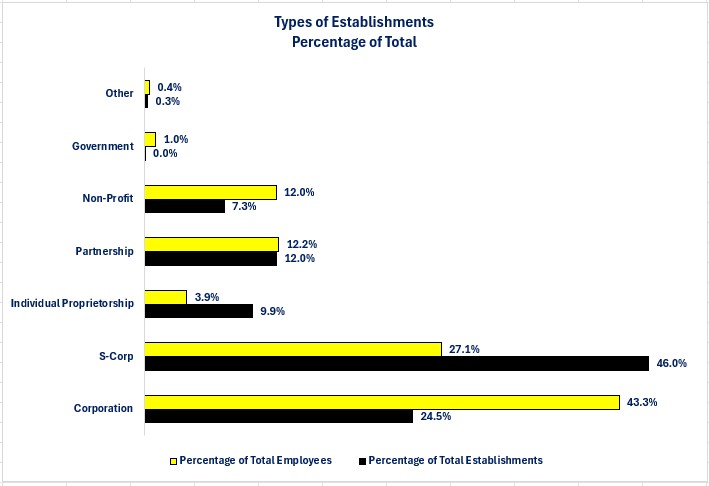
Now, let us examine the same two categories (i.e., employees and businesses) by legal structure to help us understand what the most common legal structure is and what percentage of employees work for the different types of businesses.
Types of Establishments as a Percentage of Total Businesses- The most common legal structure for a business is the S-Corporation structure but more employees work for corporations (i.e., C-corporations) than S-Corporations.
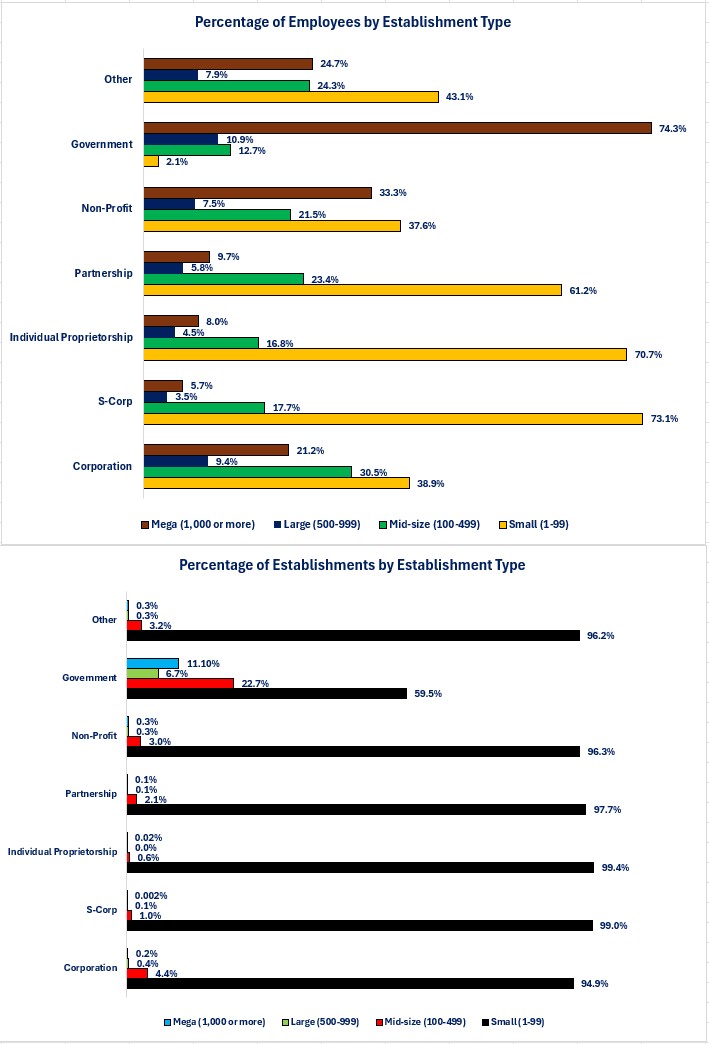
We now know what percentage of businesses exist by legal structure so, let us take it one step further. Let us know examine the percentage of employees and businesses by legal structure and size.
Percentage of Employees and Businesses by Legal Structure- When examining the various legal structure by size of businesses, the overwhelming majority fall into the Small category.
- When examining employees, all of the legal structures, except the Government category, have the highest percentage of employees in the Small category.
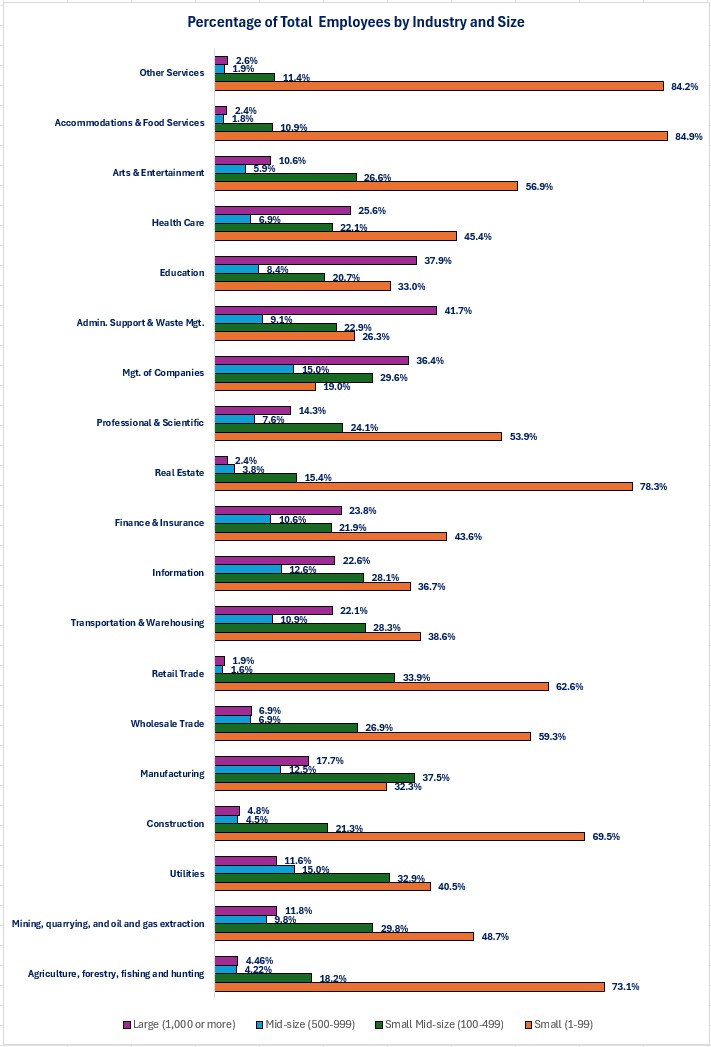
Finally, let us examine the industries to learn what business size has the highest percentage of employees.
Percentage of Employees by Industry Sector- The Small category has the highest percentage of employees for all industry sectors.
- Note: The Census Bureau did not break out Government as an industry. Its view is that government jobs exist throughout all the industry sectors.
Closing thoughts.
- No matter which way we examine the data, the evidence shows that businesses with 99 employees or fewer comprise the overwhelming majority of businesses and account for just over 50% of the employed people.
- At the risk of making an over-generalization, in general, small businesses do not normally have the resources of a large business.
-
This means that they may not have the resources or flexibility to absorb or adjust to changing policies and legislation that a larger business may have.
-
This was highlighted during the pandemic lockdown.
-
-
The larger businesses, especially those that are publicly traded, may get all of the headlines and attention of elected officials, but the reality is that small businesses remain the lifeblood for most communities.
-
As a result, it is critical that both government policies and legislation understand the potential impact of policies on the many sizes of businesses, especially small businesses.
-
A “one size fits all” approach when it comes to regulations, taxes and other policies and legislation may have unintended consequences on a small business versus a large corporation.
-
The worst scenario for a community would be healthy small businesses closing their doors or selling out to a larger business because new policies or legislation make it no longer feasible to continue the business.
-
-
With all of the noise, fear, uncertainty and change that currently exists regarding the strategy and policies of the new administration, the one message that remains critical for all communities and citizens to communicate to their elected representatives is: “Remember the small businesses and the impact on them when considering policies and legislation.”
Economic data.
|
Economic Data |
Time Period Being Reported |
Current Results |
Previous Results |
Comments |
|
2/24/25 |
|
|
|
|
|
Chicago Federal Reserve National Activity Index |
January |
-0.3 |
+0.18 |
Two out of the four sub-indexes that make up the overall index fell into negative territory. |
|
Dallas Federal Reserve Manufacturing Index |
February |
-8.3 |
+14.1 |
Manufacturing activity in the Dallas region turned sharply lower as it fell into negative territory. |
|
2/25/25 |
|
|
|
|
|
FHFA House Price Index Year-Over-Year Change |
December |
+4.7% |
+4.5% |
Home prices continued to rise to end the year. |
|
S&P-Case Shiller House Price Index Year-Over-Year Chang |
December |
+4.5% |
+4.3% |
This version of home prices reflected the same pattern as the FHFA index. |
|
Consumer Confidence Index |
February |
98.3 |
104.1 |
Uncertainty and fear over tariffs were the primary reasons cited for the sharp decline in confidence. |
|
Richmond Federal Reserve Manufacturing Index |
February |
6.0 |
-4.0 |
In contrast to the Dallas region, manufacturing activity moved into positive territory in the Richmond region. |
|
Richmond Federal Reserve Service Sector Activity Index |
February |
11.0 |
4.0 |
Service sector activity in the Richmond region improved further compared to January. |
|
Dallas Federal Reserve Service Sector Activity Index |
February |
8.2 |
5.7 |
Service sector activity in the Dallas region continued to improve. |
|
2/26/25 |
|
|
|
|
|
MBA Mortgage Applications Weekly Change |
2/21/25 |
-1.2% |
-6.6% |
Application activity suffered its second consecutive week of declines as a decline in refinancing activity drove the decline. |
|
2/21/25 |
0.0% |
-2.3% |
There was no change in the level of purchase application activity compared to the previous week. |
|
2/21/25 |
-3.5% |
+9.6% |
Activity last week reversed some the gains from the week before. |
|
2/21/25 |
6.88% |
6.93% |
Mortgage rates remain essentially unchanged and are hovering close to the 7% level. |
|
New Home Sales Monthly Change |
January |
|
+3.6% |
|
|
2/27/25 |
|
|
|
|
|
Initial Jobless Claims |
2/22/25 |
242,000 |
220,000 |
Initial claims increased 22,000 with Kentucky and Tennessee leading the increase due to layoffs in manufacturing. |
|
Continuing Jobless Claims |
2/15/25 |
1,862,00 |
1,867,000 |
Continuing claims fell 5,000. |
|
Durable Goods Orders Monthly Change |
January |
+3.1% |
-1.8% |
Transportation orders led to the increase. |
|
January |
0.0% |
+0.1% |
Core durable goods orders were unchanged from December levels. |
|
Real Gross Domestic Product Quarterly Annualized Change |
4th Quarter-First Revision |
+2.3% |
+2.3% |
The first revision to the estimate of 4th quarter annualized growth showed no change from the first estimate. |
|
Pending Home Sales Monthly Change |
January |
-4.6% |
-4.1% |
Pending home sales continued to decline as weather and interest rates were a factor. |
|
Kansas City Federal Reserve Manufacturing Activity Index |
February |
-13.0 |
-9.0 |
Manufacturing activity slumped further in February. |
|
2/28/25 |
|
|
|
|
|
PCE Price Index Year-Over-Year Change |
January |
+2.5% |
+2.6% |
The pace of inflation slowed slightly compared to December. |
|
January |
+2.6% |
+2.9% |
The pace of growth for core inflation (excluding food and energy) also slowed slightly. |
|
Personal Income Year-Over-Year Change |
January |
+4.5% |
+5.3% |
A slowing in wage growth (4.5% in January versus 5.1% in December) drove the slowing pace of growth. |
|
January |
+1.8% |
+2.4% |
The pace of income growth after taxes and inflation dropped below 2%. |
|
Personal Spending Year-Over-Year Change |
January |
+5.6% |
+5.7% |
The pace of spending slowed slightly, but it should be noted that spending fell over the last month by 0.2%. Weather was a factor. |
|
January |
+3.0% |
+3.1% |
The same pattern exists for spending adjusted for inflation. Real spending fell 0.5%. |
|
Trade Balance |
January |
-$153.26 Billion |
-$122.01 Billion |
The trade deficit widened. All else being equal, this will reduce economic growth in the 1st quarter. |
|
Retail Inventories Monthly Change |
January |
+0.4% |
-0.1% |
The rise in inventories was most likely a combination of weaker spending due to weather and inventory building in advance of tariffs. |
|
Wholesale Inventories Monthly Change |
January |
+0.7% |
-0.4% |
Same story for wholesalers as what happened with retailers. |

Steve is the Economist for Washington Trust Bank and holds a Chartered Financial Analyst® designation with over 40 years of economic and financial markets experience.
Throughout the Pacific Northwest, Steve is a well-known speaker on the economic conditions and the world financial markets. He also actively participates on committees within the bank to help design strategies and policies related to bank-owned investments.