


For the last two weeks we have learned about business applications and the trends that exist. Even though applications fell in 2024 the overall trend has risen since 2014. Today's Perspectives section examines the conversion ratio for business applications. The conversion ratio is the percentage of business applications that become businesses within the next four quarters.
Soundbite.
The economic expansion of 2010-2019 and then the stimulus funds and work-from-home environment since 2020 may have inspired more people to apply to start a business as evidenced by the rise in business applications from 2019 to 2024. That apparent enthusiasm did not convert to a higher percentage of applications resulting in actual businesses. The opposite was true as the percentage of business applications that were converted to businesses fell from 10.7% in 2019 to 6.1% in 2024.
Desiring to start a business is far different than successfully getting a business up and running. This is evidenced by the fact that the percentage of business applications converting into a business is now below 10% for the US.
-
In general, small to mid-sized states have a higher conversion ratio than the bigger states with Maine leading all states with a 17.3% conversion rate in 2014 and Delaware leading in 2024 at 16.5%.
Disclosures.
-
Data is from the Census Bureau and is as of 12/31/24
-
The conversion ratio of business applications to actual businesses formed within four quarters will be measured over three time periods.
-
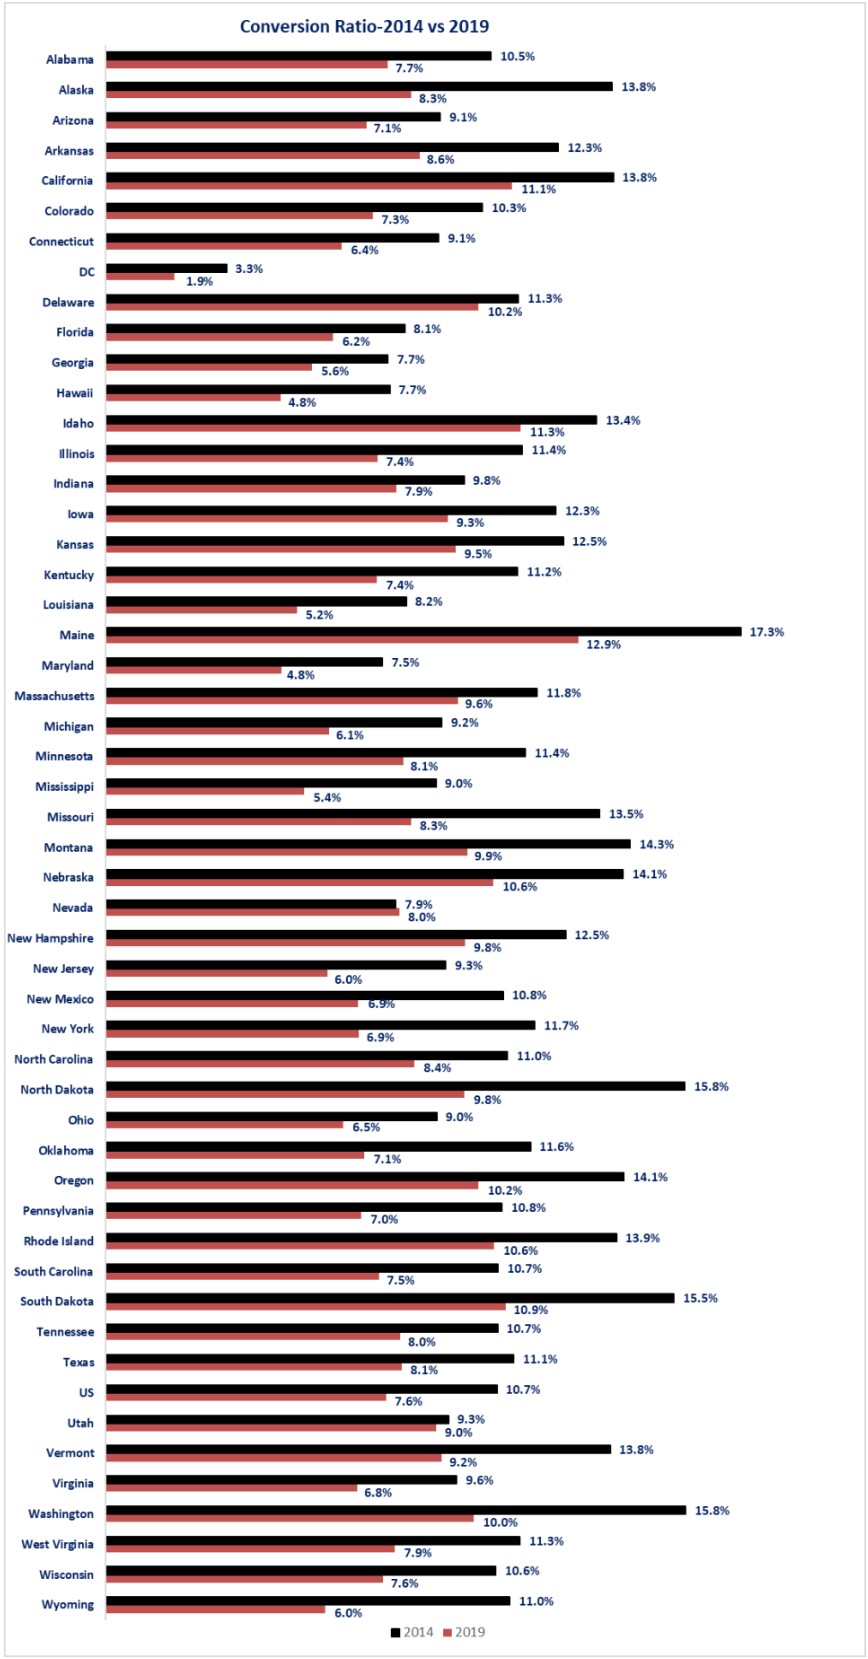
2014 versus 2019
-
2019 versus 2024
-
2014 versus 2024
-
-
Business applications are actual applications based on filings for an Employer Identification Number (EIN) with the IRS.
-
Business formations are a combination (i.e. spliced) data set using actual businesses formed and then projected formations for the time period where four quarters have not yet passed.
-
The Census Bureau bases its projections on historical data that identifies the types of business applications with a historically high propensity for forming a business.
-
Observations.
-
The overall conversion rate in the US fell from 10.7% in 2014 to 7.6% in 2019.
-
Maine had the highest overall conversion rate in 2014 at 17.3%.
-
California had the highest conversion rate for bigger states in 2014 at 13.8%
-
Maine also had the highest overall conversion rate in 2019 at 12.8%.
-
California had the higher conversion ratio for bigger states in 2019 at 11.1%.
-
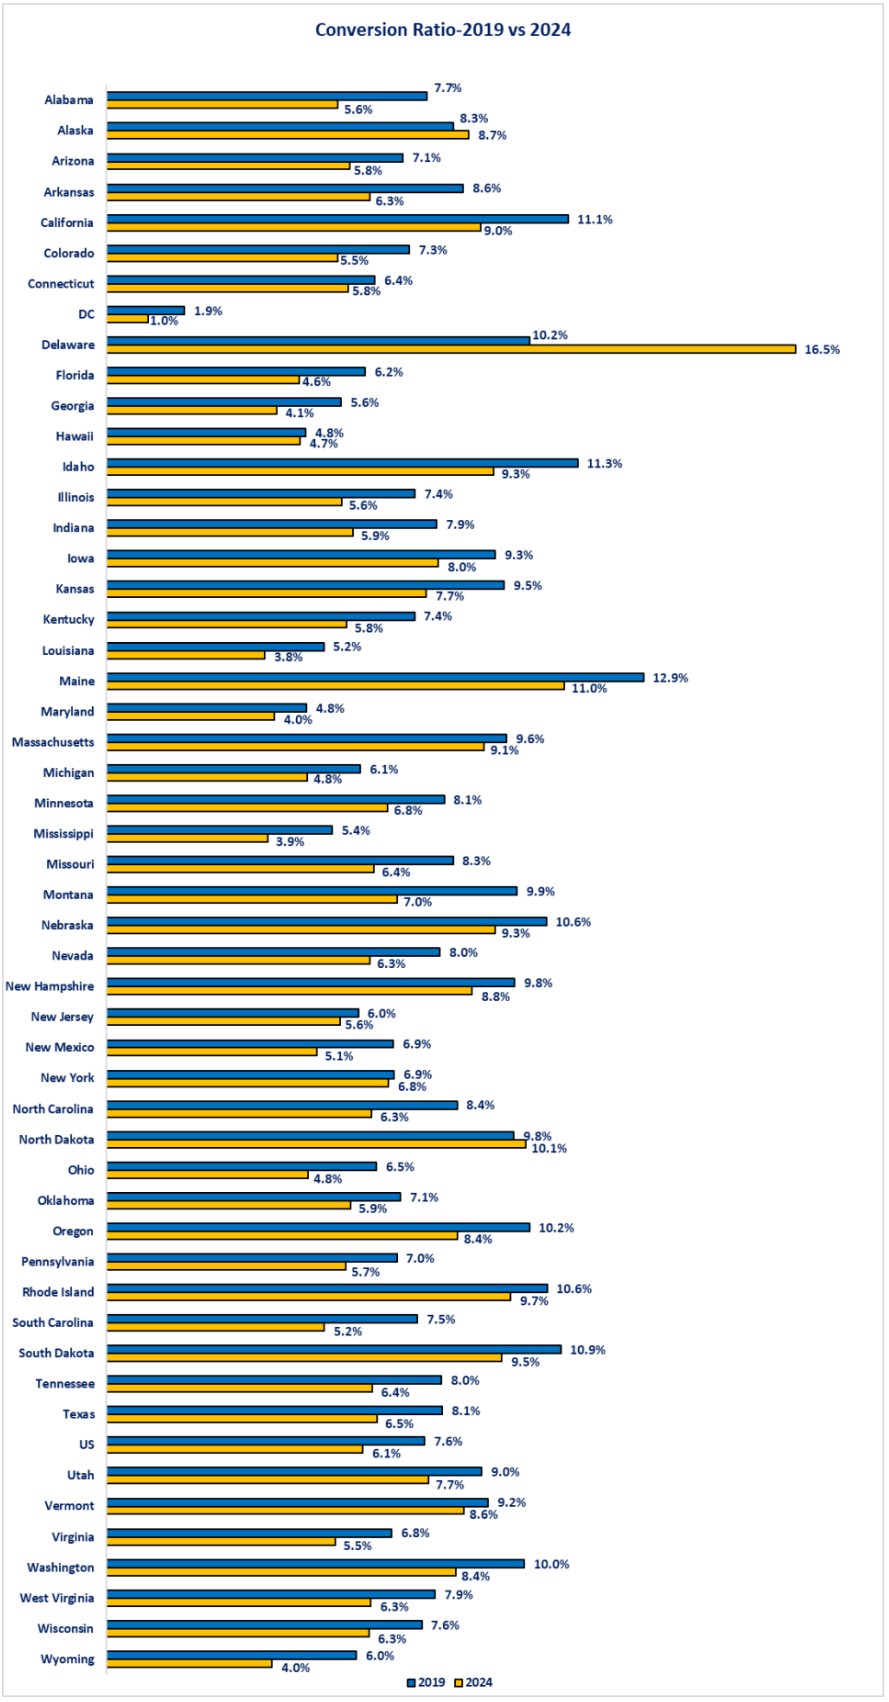
Conversion Ratio-2019 vs 2024
-
The declining trend continued between 2019 and 2024 as the US experienced a decline from 7.6% in 2019 to 6.1% in 2024.
-
Delaware was the outlier as its conversion ratio rose from 10.2% in 2019 to 16.5% in 2024.
-
Massachusetts had the highest 2024 conversion rate for bigger states at 9.1%
-
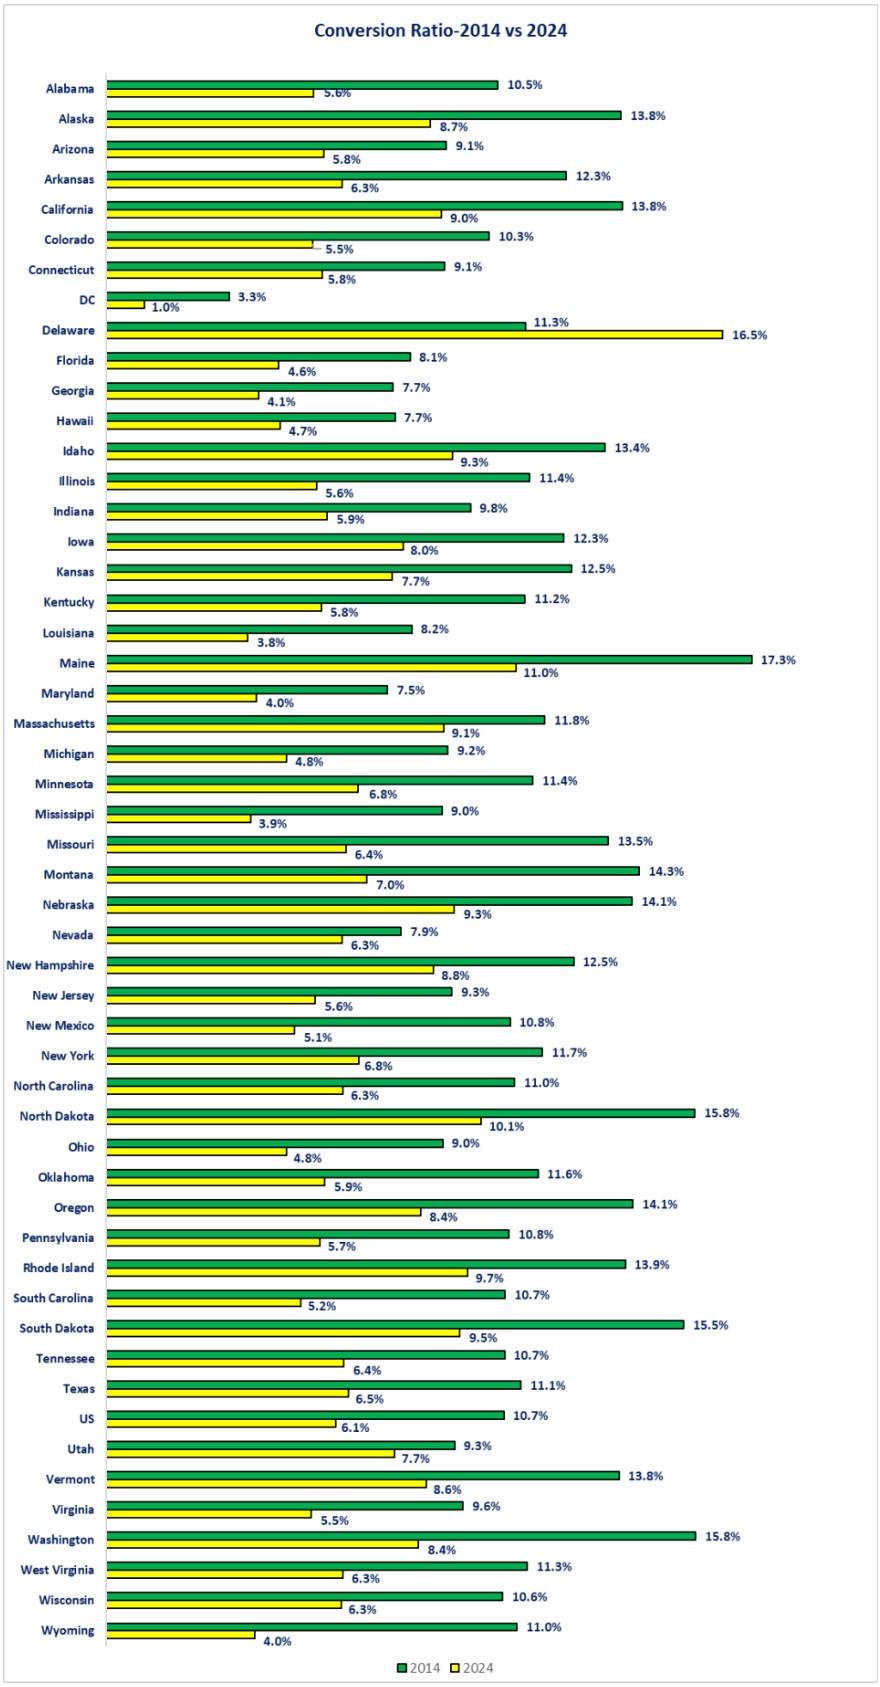
Conversion Ratio-2014 vs 2024
-
Overall, the US experienced a 4.6 percentage point decrease in the conversion rate from 2014 to 2024.
-
The rate declined from 10.7% to 6.1%
-
-
Delaware experienced the biggest increase as its conversion ratio rose from 11.3% to 16.5%.
-
Washington experienced the biggest percentage point decline as its conversion ratio fell from 15.8% to 8.4%.
Closing thoughts.
- As discussed over the past two weeks, business applications are important to follow since they are the first step toward forming a business, creating jobs and, ultimately, income.
- Business formations are the more critical data set since they are the actual businesses that formed within four quarters of a business application being filed.
-
The conversion ratio gives us insight into understanding what percentage of business applications convert into a wage-paying business within four quarters. These are the actual businesses that would create jobs and income.
-
What the data shows us over the past ten years is a variety of positive factors (i.e., the economic expansion of 2010-2019, the stimulus funds in 2020 and 2021 and the work-from-home environment since 2020) may have inspired more people to apply to start a business.
-
That inspiration and enthusiasm did not convert to a higher percentage of applications resulting in actual businesses.
-
The opposite was true as the percentage of business applications that converted to a business fell from 10.7% in 2019 to 7.6% in 2024.
-
-
The data at the state level shows the same basic story with a decline in the conversion ratio from 2014 to 2024 occurring with all states except Delaware.
-
Perhaps the lesson learned is: desiring to start a business is far different than successfully getting a business up and running.
-
This is evidenced by the fact that the percentage of business applications converting into a business is now below 10% for the US and no higher than 16.5% at a state level.
-
Economic data.
|
Economic Data |
Time Period Being Reported |
Current Results |
Previous Results |
Comments |
|
2/17/24 |
|
|
||
|
No Economic Data Releases |
|
|
||
|
2/18/24 |
|
|
||
|
New York Federal Reserve Manufacturing Activity Index |
February |
5.70 |
-12.60 |
Manufacturing activity rose into positive territory in February. |
|
National Association of Home Builders Housing Market Index |
February |
42.0 |
47.0 |
Worries over the potential impact of tariffs on the housing market caused builder confidence to fall. |
|
2/19/25 |
|
|
||
|
MBA Mortgage Application Index Weekly Change |
2/14/25 |
-6.6% |
+2.3% |
Applications fell for both purchases and refinancing. |
|
2/14/25 |
-5.9% |
-2.3% |
Winter weather was a factor in last week's decline. |
|
2/14/25 |
-7.3% |
+9.6% |
Winter weather and no real change in mortgage rates contributed to the decline. |
|
2/14/25 |
6.93% |
6.95% |
No real change from the previous week. |
|
Housing Starts Monthly Change |
January |
-9.8% |
+15.8% |
Weather was once again a factor. Single family starts fell 8.4% while multi-family starts fell 11.0%. |
|
Building Permits Monthly Change |
January |
+0.1% |
-0.7% |
All of the increase was from muti-family permits as single family permits were unchanged from December. |
|
2/20/24 |
|
|
||
|
Initial Jobless Claims |
2/15/25 |
219,000 |
214,000 |
Initial claims rose 5,000 last week. |
|
Continuing Jobless Claims |
2/15/25 |
1,869,000 |
1,845,000 |
Continuing claims rose 24,000. |
|
Philadelphia Federal Reserve Manufacturing Index |
February |
18.1 |
44.3 |
Manufacturing activity in the Philadelphia region showed a sharp slowdown. |
|
Leading Indicators Monthly Change |
January |
-0.3% |
+0.1% |
Last month’s result was revised up from -0.1% to plus 0.1%. January moved back into negative territory. |
|
2/21/25 |
|
|
||
|
Existing Home Sales Monthly Change |
January |
-4.9% |
+2.9% |
Weather was a factor for existing home sales similar to new home sales. |
|
University of Michigan Consumer Sentiment Index |
February |
64.7 |
71.1 |
Consumer confidence fell further as worries over potential higher prices weighed on consumer sentiment |
|
|
65.7 |
74.0 |
Consumers became more pessimistic about their current situation. |
|
|
64.0 |
67.3 |
The outlook for the future also became more pessimistic. |

Steve is the Economist for Washington Trust Bank and holds a Chartered Financial Analyst® designation with over 40 years of economic and financial markets experience.
Throughout the Pacific Northwest, Steve is a well-known speaker on the economic conditions and the world financial markets. He also actively participates on committees within the bank to help design strategies and policies related to bank-owned investments.