


Last week's Perspectives section examined new business applications by industry. This week we will examine new business applications by state. Understanding trends in new business applications at the state level may help us understand where new jobs creation may occur since a business application is the first step in creating a new business.
Soundbite.
As we learned last week, new business applications fell in 2024 compared to 2023. The story at the state level was bifurcated.
-
Washington experienced the best one-year growth at +16.1% while Louisiana had the worst decline at -15.1%.
-
Six states experienced positive one-year growth while 45 states (including DC) experienced declines.
One trend that needs to be monitored is the rise in new business applications as a percentage of total jobs over the past five years. A rise in the percentage implies that fewer new business applications are converting to actual businesses and creating jobs.
Disclosures.
-
Data is from the Census Bureau.
-
Data is as of 12/31/24.
-
Four areas will be examined.
-
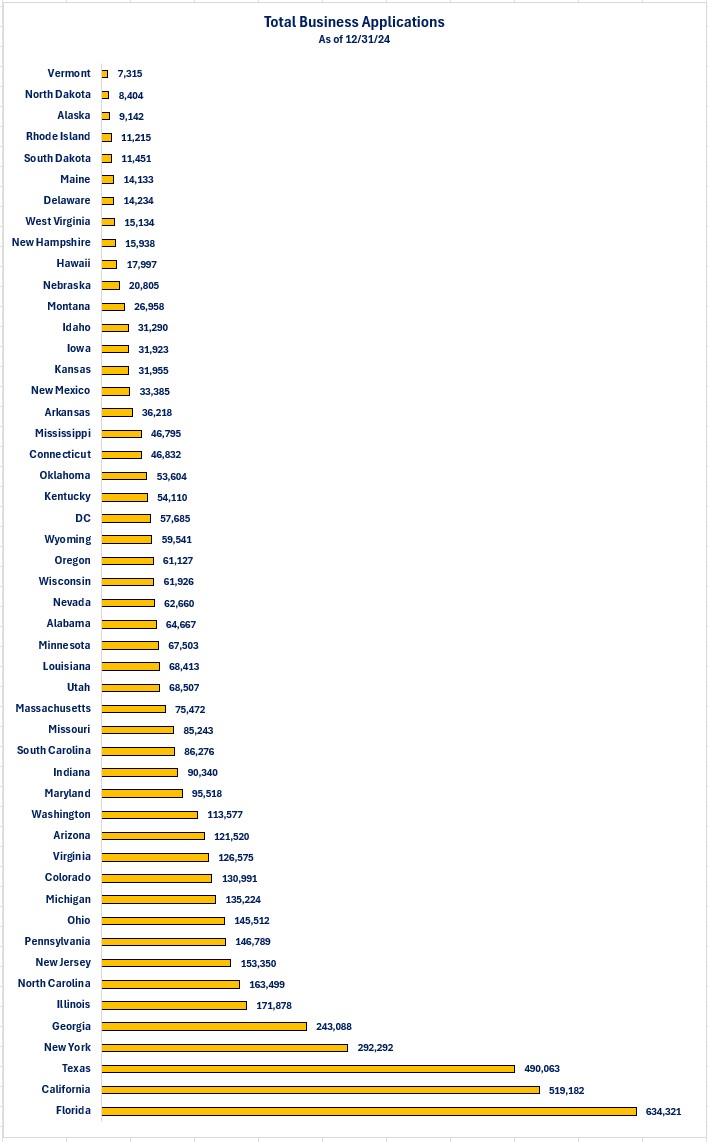
Total new business applications by state.
-
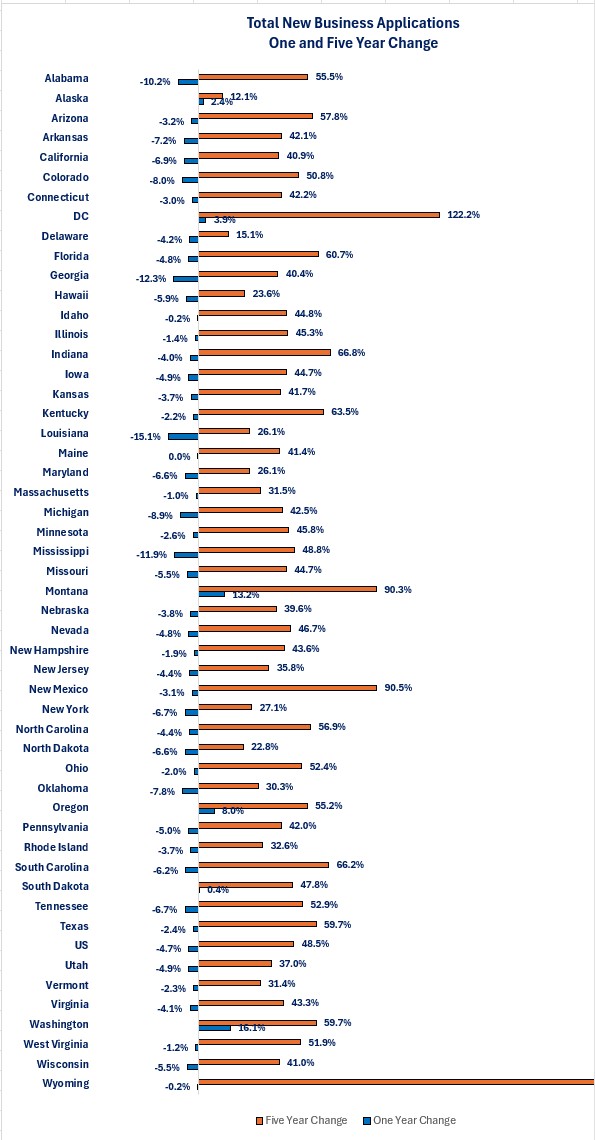
Growth in new business applications by State over one year and five years.
-
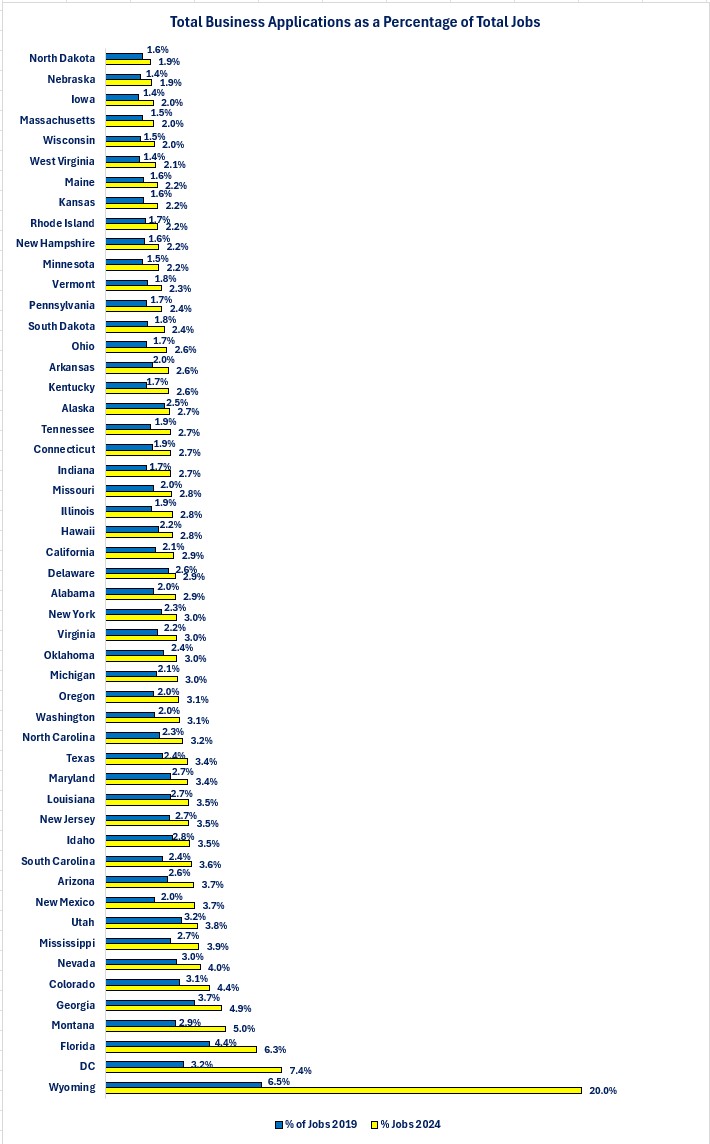
Total new business applications as a percentage of total jobs by state.
-
Five years ago (2019)
-
Current (2024)
-
-
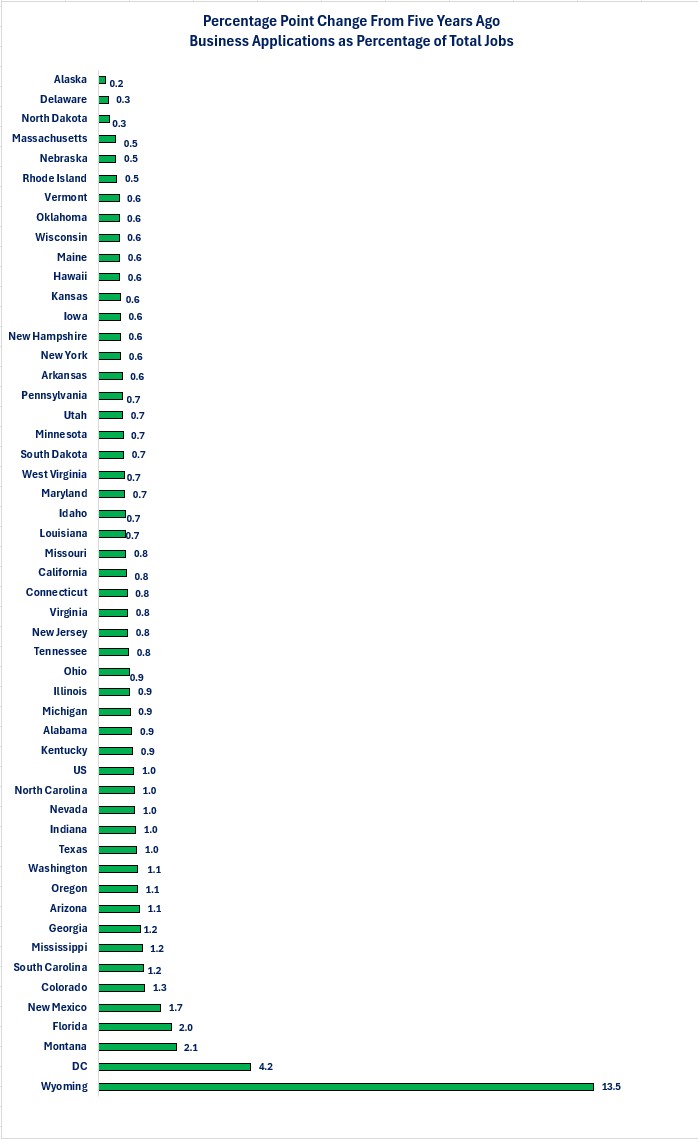
The percentage point change from five years ago.
-
Observations.
- It should come as no surprise that the states with the largest populations had the most new business applications but it was not a one-for-one relationship between population size and the number of new business applications.
-
Florida is #1 for new business applications, but #3 for population.
-
Georgia is #5 for new business applications but #12 for population.
-
Wyoming is #51 population but #23 for new business applications.
-
The District of Columbia (DC) is #49 for population but #22 for new business applications.
-
Total New Business Applications by State-One and Five Year Change
-
Overall, total new business applications fell 4.7% year-over-year in the US in 2024.
-
Only six states experienced positive year-over-year growth.
-
Washington: +16.1%
-
Montana: +13.2%
-
Oregon: +8.0%
-
DC: +3.9%
-
Alaska: +2.4%
-
South Dakota: +0.4%
-
-
Four states experienced declines of 10% in year-over-year growth in 2024.
-
Louisiana: -15.1%
-
Georgia: -12.3%
-
Mississippi: -11.3%
-
Alabama: -10.2%
-
-
Since size is such a key factor when examining new business applications by state, it is hard to derive any real insights by comparing growth rates. Trying to compare by number of applications presents the same problem. In an effort to give a better way to compare, I analyzed total new business applications as a percentage of total jobs by state. This eliminates the size factor and helps us identify trends that are comparable by state.
My reasoning for examining this ratio is that if the business application converts to a new business, then new jobs are created. This ratio gives us perspective on whether new business applications are converting to actual new businesses and jobs. A rising ratio implies that a higher percentage of new business applications are not converting to new jobs while a lower ratio implies more applications are converting to new jobs.
Total New Business Applications by State as a Percentage of Total Jobs- All states showed an increase in new business applications as a percentage of total jobs.
-
Wyoming is the clear outlier.
-
Wyoming saw a surge in new business applications after the pandemic crisis and that pace has continued to far outpace jobs growth since then.
-
Since the surge occurred in 2024, it is too early to tell if the surge will result in a surge of new jobs being created.
-
The above graph illustrated that all states saw in increase in the total new business applications as a percentage of total jobs compared to five years ago. The question is how much of a change occurred. The following graph illustrates the percentage point change that occurred.
New Business Applications by State as a Percent of Total Jobs-Percentage Point Change From Five Years Ago-
Sixteen states had a positive percentage point change of at least one percent from five years ago.
-
The US experienced a one percentage point change.
-
-
Three states had a percentage point change of 0.3% or less from five years ago.
-
Alaska, Delaware, and North Dakota
-
Closing thoughts.
- As discussed last week, new business applications are the first step toward starting a new business, generating new jobs and income.
-
Over the past year, the US experienced a decrease in the number of new business applications.
-
The results were bifurcated when examined at the state level.
-
Six states experienced year-over-year growth while 45 states (including DC) experienced declines.
-
-
Whether the declines were due to people waiting for the election results, a rising level of uncertainty or other reasons are unknown but will need to be monitored going forward to see if a downward trend is being established.
-
-
Overall, the US has seen a 48.5% increase in new business applications since 2019.
-
63% of the states experienced growth below 48.5% and 37% were above.
-
Wyoming experienced the strongest five-year growth at 212.9% while Alaska experienced the lowest at 12.1%.
-
-
One of the trends over the past five years that needs to be monitored is the rise in business applications as a percentage of total jobs.
-
All states experienced an increase in this percentage.
-
Wyoming was the clear outlier with a surge in new business applications that started after the pandemic crisis and has continued.
-
On the surface that may seem good, but beneath the surface it is not good because new business applications as a percentage of total jobs also surged.
-
-
-
A rise in the ratio of new business applications to total jobs indicates that a smaller percentage of the new business applications are converting to new businesses and jobs. There are a variety of reasons this may be occurring.
-
One of the reasons may be that, after experiencing the work-from-home environment, people decided that they wanted to control their work-life balance by running their own business. As a result, they started the new business formation process by completing a new business application. Then, reality may have set in as they discovered that the potential financing cost of starting a business and the myriad other costs and time demands (i.e., tax filing, regulatory reporting, bookkeeping, etc.) of running their own business did not justify forming the business. Thus, applications rise but new businesses are not created and the percentage of applications to total jobs rises.
-
-
Next week's Perspectives section will examine the types of business applications that historically have resulted in new businesses forming at the state level.
Economic data.
|
Economic Data |
Time Period Being Reported |
Current Result |
Previous Result |
Comments |
|
2/10/25 |
|
|
|
|
|
No data released |
|
|
|
|
|
2/11/25 |
|
|
|
|
|
NFIB Small Business Optimism Index |
January |
102.8 |
105.1 |
The post-election surge lost ground in January as small business owners reported a rising level of uncertainty. |
|
2/12/25 |
|
|
|
|
|
Consumer Price Index (CPI) Year-Over-Year Change |
January |
+3.0% |
+2.9% |
Prices rose more than expected even before tariffs were put in place. |
|
January |
+3.3% |
3.2%+ |
Core CPI is one of the two inflation indices the Federal Reserve monitors. January's result will not give them comfort. |
|
MBA Mortgage Applications Weekly Change |
2/7/25 |
+2.3% |
+2.2% |
The pace of growth in applications was virtually the same as the week before. |
|
2/7/25 |
-2.3% |
-3.0% |
Applications to purchase a home continued to decline. |
|
2/7/25 |
+9.6% |
+12.1% |
Applications to refinance drove the overall increase in applications. |
|
2/7/25 |
+6.95% |
+6.97% |
Mortgage rates remained just below 7%. |
|
2/13/24 |
|
|
|
|
|
Producer Price Index Year-Over-Year Change |
January |
+3.5% |
+3.3% |
Like the Consumer Price Index, prices rose faster than December's pace. |
|
January |
+3.6% |
+3.5% |
The story was not any better when excluding food and energy prices. |
|
Initial Jobless Claims |
2/8/25 |
213,000 |
220,000 |
Claims fell 7,000 compared to the previous week. |
|
Continuing Jobless Claims |
2/1/25 |
1,850,000 |
1,886,000 |
Continuing claims fell 36,000. |
|
Retail Sales Year-Over-Year Change |
January |
+4.2% |
+4.4% |
On a year-over-year basis, retail sales fell because December's growth was revised higher from 3.9% to 4.4%. |
|
January |
-0.9% |
+0.4% |
Retail sales fell over the past month led by a 2.8% decline in motor vehicle and parts sales. |
|
January |
-0.4% |
+0.4% |
Core retail sales did not fall as much as the headline number. |
|
Industrial Production Monthly Change |
January |
+0.5% |
+1.0% |
Energy production kept monthly growth positive. |
|
January |
-0.1% |
+0.5% |
Manufacturing fell into negative growth for January. |

Steve is the Economist for Washington Trust Bank and holds a Chartered Financial Analyst® designation with over 40 years of economic and financial markets experience.
Throughout the Pacific Northwest, Steve is a well-known speaker on the economic conditions and the world financial markets. He also actively participates on committees within the bank to help design strategies and policies related to bank-owned investments.