


Business applications are the first step toward a company or individual starting a new business. This week's Perspectives will start a three-part series examining business applications and formations. This week we will examine business applications by industry and next week will examine them by states. The third week will then take it a step further to see what type of businesses are being formed. Why should we care about business applications? I believe the primary reason is that new businesses create new jobs which create new income that supports economic growth. Tracking the trend for business applications helps us understand how the new business process is functioning.
Soundbite.
Applications to form a new business declined in 2024. This may be because businesses and individuals were taking a “wait and see” approach due to the uncertainty and noise of the national elections.
-
Fourteen industries experienced a decline in applications over the past year.
-
The Retail Trade sector had the most applications over the five- and ten-year periods.
-
The Mining Sector experienced declines in application for all time periods.
We will have to wait to see as 2025 data comes in to know whether 2024 was a temporary downturn or the start of a trend.
Disclosures.
-
The data comes from the Census Bureau as of 12/31/24.
-
The Census Bureau breaks many of the major industry sectors into smaller industry sectors to provide better insight into trends for the various parts of a major industry.
-
The Census Bureau has twenty sectors versus the eleven sectors used by the Bureau of Labor Statistics.
-
-
Business applications will be examined from four perspectives:
-
Cumulative growth in applications for one, five and ten years.
-
Cumulative growth rate for one, five and ten years.
-
Percentage of total applications for each industry as of year-end 2014, 2019, and 2024.
-
Percentage point change from five and ten years ago.
-
-
The Census Bureau has an industry sector identified as No Classification. This is essentially a “parking place” as an application may not have received its final sign-off on its industry classification.
-
I have excluded this category from the analysis and adjusted total applications.
-
Observations.
Let us start by examining the year-over-year growth patterns for the US over the past ten years.
Business Applications-Trend for Total Applications-
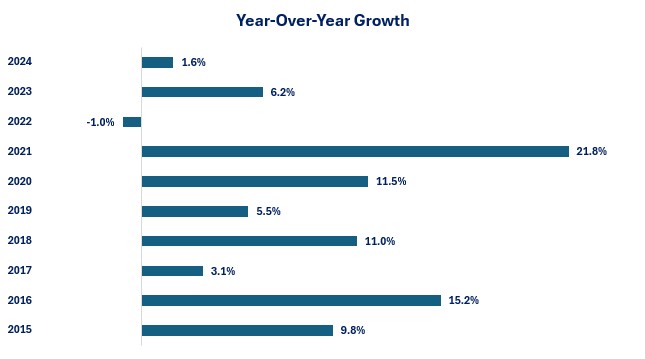
The growth in business applications turned negative in 2024 after solid growth in 2023.
-
The year-over-year growth in 2024 was -5.2% compared to +7.62% in 2023.
-
-
Although the yearly change is volatile, 2024 still was the slowest pace of applications other than 2022.
-
This may have been a result people and businesses taking a “wait and see” stance due to the noise and uncertainty over the national election.
-
2022 was most likely an unwinding of the unsustainable pace of growth in 2020 and 2021. The surge in 2020 and 2021 was due to a combination of the work-from-home environment and stimulus funds. This inspired many people to apply for a new business application in order to strike out on their own and be their own boss.
-
Now, let us examine the cumulative change in the number of applications over the past one, five, and ten years.
Business Applications by Industry-Cumulative Change-
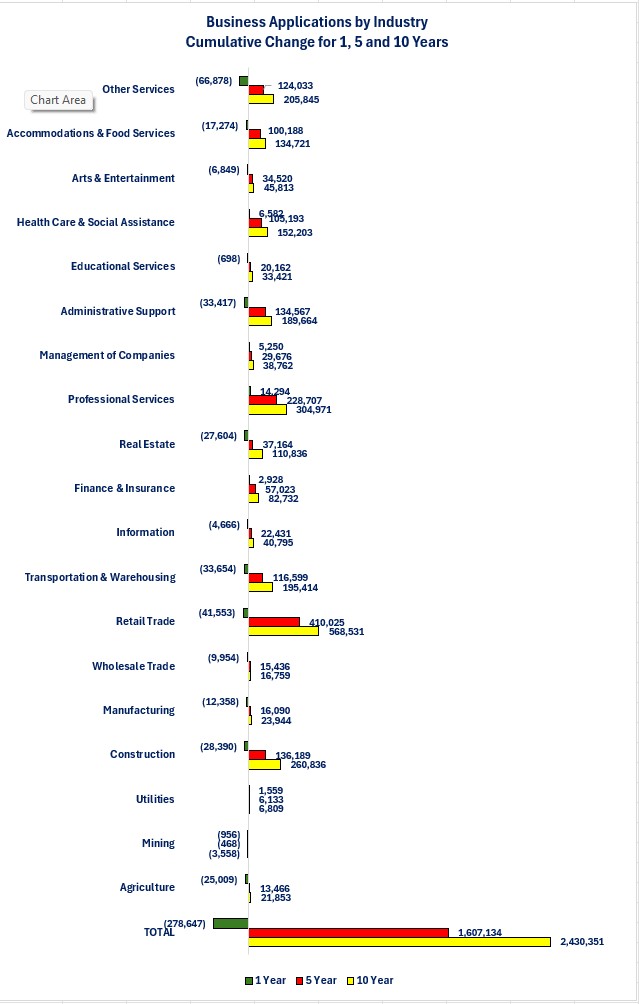
Over the last ten years, the Retail Trade industry is the one that has seen the most applications to start a business. Professional Services was second and Construction was third.
-
Mining & Logging is the only industry that experienced declines in applications for all time periods.
-
Over the past twelve months, fourteen industries have experienced declines in business applications.
-
The Other Services industry experienced that biggest drop in applications over the past year. Retail Trade was second and Transportation & Warehousing was third.
-
Another way to examine trends in business applications is to examine the cumulative growth rate of each industry.
Business Applications by Industry-Cumulative Growth-
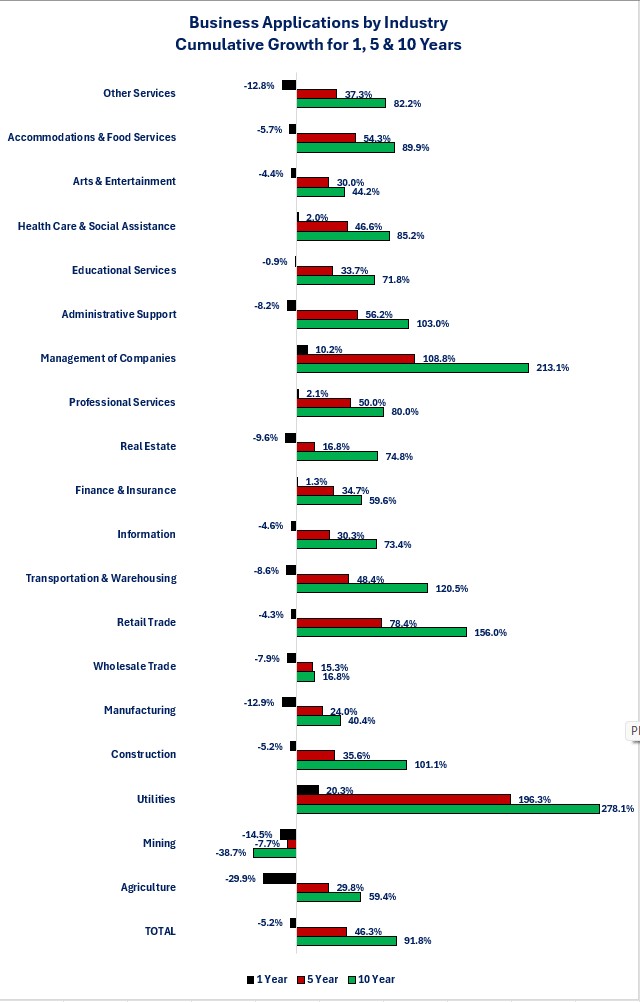
One of the problems with examining growth rates is that size matters. A small industry can achieve a large growth rate without actually adding a substantial number of new applications.
-
Utilities showed a 278.1% ten-year growth rate, but it added 6,089 new applications over the past ten years. That is only 0.3% of the 2,430,351 new applications that occurred during this period.
-
Manufacturing had the lowest ten-year growth rate at 40.4% yet it almost quadrupled the number of applications (23,944) compared to Utilities.
-
-
Even though the Agriculture industry had the biggest decline in its one-year growth rate, it ranked seventh (out of fourteen) for the actual number of business application declines.
Since growth rates can be distorted due to size, let us look at any trends in the percentage of total business applications each industry comprises.
Business Applications by Industry-Percent of Total-
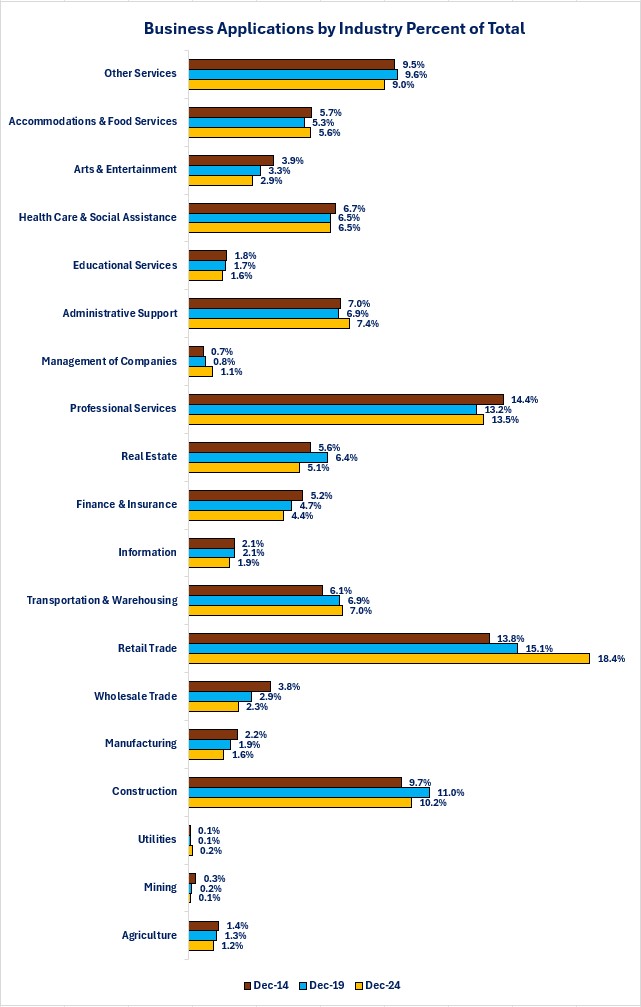
The Retail Trade, Transportation & Warehousing, and Management of Companies industries were the only industries that showed a rising trend over all time periods.
-
Even though the Retail Trade industry is one with low profit margins, and ongoing labor shortage issues, it is still the industry sector that makes up the largest percentage of total new business applications.
-
The Utilities industry makes up the smallest percentage.
-
The last way to examine the data is to identify which industries saw the biggest percentage increase/decrease in their percentage of total business applications compared to five and ten years ago.
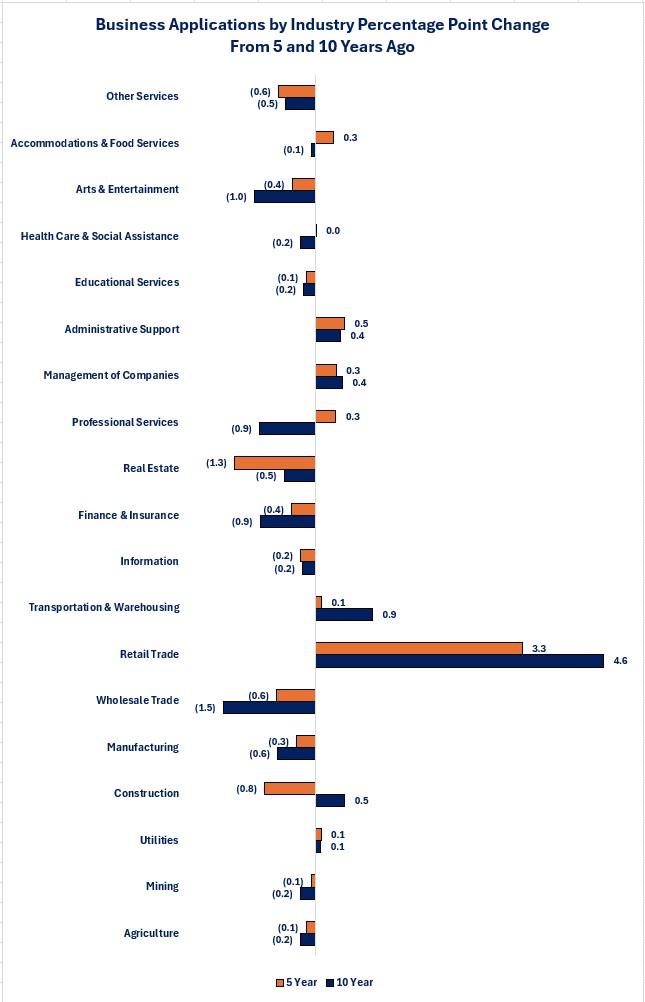
Business Applications by Industry-Percentage Change-
Only four out of the twenty industries experienced percentage point increases compared to five and ten years ago.
-
Administrative Support
-
Management of Companies
-
Retail Trade
-
Transportation & Warehousing
-
-
Ten out of the twenty experienced percentage decreases compared to five and ten years ago and six out of the twenty showed mixed results.
Closing thoughts.
- There was a clear change in direction for business applications in 2024 compared to 2023 as well as the previous ten years. Without knowing specific details, three possibilities come to mind that may have been a factor.
- Uncertainty over the national elections causing people and businesses that were thinking about starting a business to wait and see the election results.
-
With the job market still firm and year-over-year wage growth at 3.5%, people may be reluctant to take the risk of starting a new business when their current situation is stable.
-
The Bureau of Labor Statistics data shows that over 20.4% of new businesses fail in their first year.
-
-
Continued high financing costs.
-
Even though it is currently anticipated that the Federal Reserve will lower its overnight borrowing rate by another 0.50% by the end of the year, the outlook is far less clear for intermediate to long-term rates.
-
Inflation and the level of debt being issued by the government and corporations are the driving factors for intermediate and long-term rates, not the Federal Reserve.
-
It remains to be seen what the impact from fiscal policies from the new administration and Congress will do to those two key factors.
-
-
-
The biggest shift over the past ten years is that the business applications in Retail Trade industry now make up a larger percentage of the applications.
-
The advent of e-commerce and the ease for someone to start an online business at home may be the driving force behind this shift.
-
Remember that business applications are only the start of the process for forming a new business. Whether the higher level of Retail Trade applications truly resulted in more Retail Trade businesses being formed remains to be seen.
-
-
-
There are several factors that could boost business applications in 2025.
-
Both business and consumer confidence have risen since the end of the elections.
-
Tax cuts and/or de-regulation may also lower the barriers to starting a new business.
-
-
In another example of bifurcation, a decline in total applications does not mean that all industries had declines.
-
Six industries saw positive growth in business applications over the past year.
-
-
We will have to wait for 2025 data to determine whether 2024's decline was a temporary downturn or the start of a trend.
-
As the first graph highlights, the previous pattern shows a rebound in applications after a year of low or negative applications.
-
If uncertainty is the reason for the slowdown in 2024 then that may keep applications at a low growth rate in 2025 if people and businesses remain in “wait and see” mode.
-
Economic data.
|
Economic Data |
Time Period Being Reported |
Current Results |
Previous Results |
Comments |
|
2/3/24 |
|
|
|
|
|
S&P Global Manufacturing PMI |
January |
51.2 |
49.4 |
Manufacturing activity finally moved into positive territory. |
|
Construction Spending Monthly Change |
December |
+0.5% |
+0.2% |
Activity picked up slightly in December. |
|
ISM Manufacturing PMI |
January |
50.3 |
45.4 |
ISM's version of the manufacturing PMI also moved into positive territory. |
|
2/4/24 |
|
|
|
|
|
Factory Orders Monthly Change |
December |
-0.9% |
-0.8% |
Continued declines in transportation orders pushed the index lower. |
|
December |
+0.3% |
+0.3% |
The pace of growth remained the same as November. |
|
Job Openings and Labor Turnovers |
December |
7,600,000 |
8,150,000 |
The number of job openings declined 550,000 compared to November. |
|
2/5/25 |
|
|
|
|
|
MBA Mortgage Applications Weekly Change |
1/31/25 |
+2.2% |
-2.0% |
An increase in applications to refinance drove the positive results. |
|
1/31/25 |
-3.0% |
-0.4% |
This is the second consecutive week of declines. |
|
1/31/25 |
+12.1% |
-0.7% |
A slight decline in mortgage rates triggered more refinancing activity. |
|
1/31/25 |
6.97% |
7.02% |
A decline in 10-year Treasury rates helped push 30-year mortgage rates below 7%. |
|
Trade Balance |
December |
-$98.4 billion |
-$78.9 billion |
A surge in imports caused the trade deficit to widen. This may have been businesses stocking up on supply before the threatened tariffs were set to go in place. |
|
December |
$266.5 billion |
$273.6 billion |
Exports fell. |
|
December |
-$364.9 billion |
-$353.5 billion |
Imports rose. This may have been businesses stockpiling in case tariffs were enacted in February. |
|
ADP Nonfarm Payrolls Monthly Change |
January |
183,000 |
176,000 |
Jobs growth remained steady. |
|
S&P Global Services PMI |
January |
52.7 |
55.4 |
As the manufacturing PMI rose, the service sector PMI fell. |
|
ISM Non-Manufacturing PMI |
January |
52.9 |
56.8 |
ISM's results showed the same trend as S&P Global. |
|
2/6/25 |
|
|
|
|
|
Challenger Jobs Cuts Year-Over-Year Change |
January |
-39.5% |
+11.4% |
Announced layoffs declined compared to December. |
|
Initial Jobless Claims Weekly Change |
2/1/25 |
219,000 |
208,000 |
Initial claims remain within the range that has existed over the last year. |
|
Continuing Jobless Claims |
2/1/25 |
1,888,000 |
1,850,000 |
Layoffs may not be increasing, but if you are laid off, it is taking longer to find a new job. |
|
Nonfarm Productivity Quarterly Change |
4th Quarter |
+1.2% |
+2.3% |
Productivity rose but at a slower pace than in the third quarter. |
|
2/7/24 |
|
|
|
|
|
Nonfarm Payrolls Monthly Change |
January |
143,000 |
307,000 |
The slower jobs growth was not as slow as the headline results because November's number was revised up 49,000 and December's number was revised up 51,000. |
|
Average Hourly Earnings |
January |
4.1% |
4.1% |
Continued solid wage growth is good for the consumer but will not give the Federal Reserve any comfort. |
|
Average Weekly Earnings |
January |
3.8% |
+3.5% |
A rising trend will not inspire the Federal Reserve to lower interest rates. |
|
Labor Force Participation Rate |
January |
62.6% |
62.5% |
More of the population joined the labor force in January. |
|
Unemployment Rate |
January |
4.0% |
4.1% |
The unemployment rate remains in a range that shows a solid economy. |

Steve is the Economist for Washington Trust Bank and holds a Chartered Financial Analyst® designation with over 40 years of economic and financial markets experience.
Throughout the Pacific Northwest, Steve is a well-known speaker on the economic conditions and the world financial markets. He also actively participates on committees within the bank to help design strategies and policies related to bank-owned investments.