


Last week's Perspectives section examined the domestic migration patterns for states as identified using U-Haul data. Migration patterns within the US helps us understand movement into and out of states. It does not help a business understand whether that movement is increasing or decreasing the labor force. Businesses care about the growth patterns of the labor force since the labor force is the source for filling open jobs. The Labor Force Participation Rate can help businesses identify states where more of the population is participating in the labor force and states that are experiencing decreases.
Soundbite.
The Labor Force Participation Rate is a data set that allows you to understand what percentage of the working age population in the US is participating in the labor force. This is important since the labor force is where businesses draw from to fill open jobs.
-
Currently, 58% of the states have a LFPR above the US level of 62.5% while 42% are below.
-
States with a low LFPR face a headwind for economic growth since a higher percentage of the population is consuming goods and services without contributing to the labor force. If businesses cannot increase jobs to meet the demand for services, economic growth will be limited.
Disclosures.
Labor Force Participation Rate:
The LFPR is the percentage of the civilian working age population (16 years and older) who are either working or actively seeking work.
Source:
Bureau of Labor Statistics (BLS)
I will examine the following:
-
Current LFPR
-
Change in the LFPR for the past one, five and ten years.
-
Since state level data is one month behind national level data, the data will be from 11/30/14 to 11/30/24.
Observations.
-
Currently, 29 states (58%) have a LFPR above the US level of 62.5%.
-
This is another illustration of the bifurcation in the US economy,
-
-
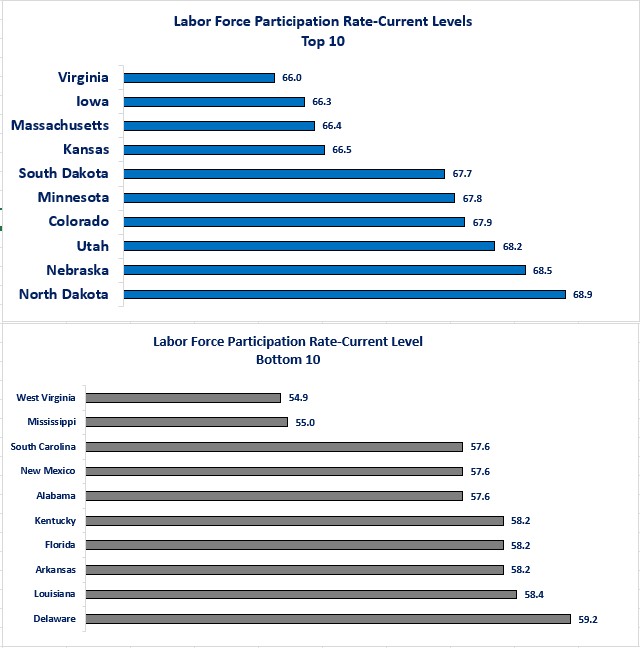
If a business was simply looking at the current levels, the top ten states may appear attractive since these are states where more of their civilian age population is engaged in the labor force.
Current levels could be deceiving since simply looking at the current level does not give you any information about the trends. What a business would most likely be interested in is whether the trend is improving or deteriorating. A state in the top ten for current level but shows a deteriorating trend may be less attractive than a state not in the top ten but with an improving trend. Let us start by taking a long view and see which states had the best improvement and worst deterioration over the past ten years.
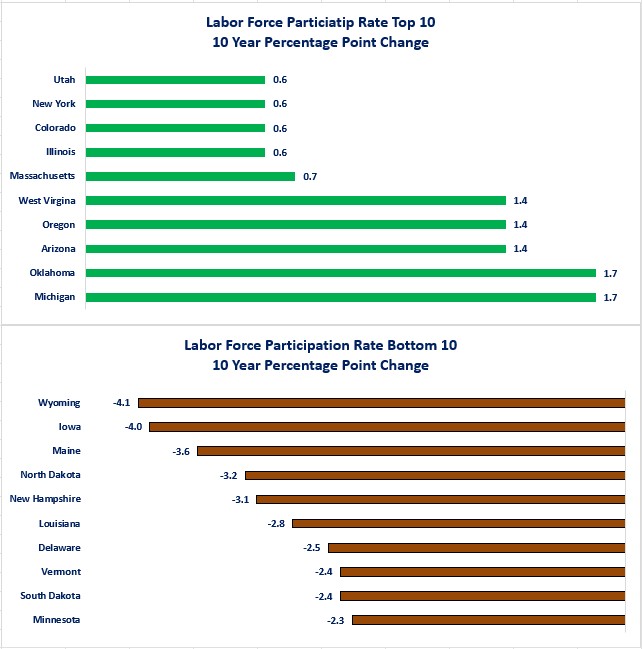
Percentage Point Change From Ten Years Ago
-
Michigan and Oklahoma showed the biggest improvement over the past ten years while Wyoming and Iowa showed the biggest deterioration. Only Massachusetts and Utah are in the top ten for current level and trend improvement.
-
Iowa and North Dakota are both examples of states in the top ten for current level but are in the top ten for worst trend deterioration.
Now, let us examine the percentage change that has occurred over the past five years. This will give perspective as to whether the ten-year improvement or deterioration occurred consistently or whether it happened in earlier times and has improved or deteriorated over the past five years. Businesses would most likely be more encouraged to see a state that was in the top ten for ten and five years.
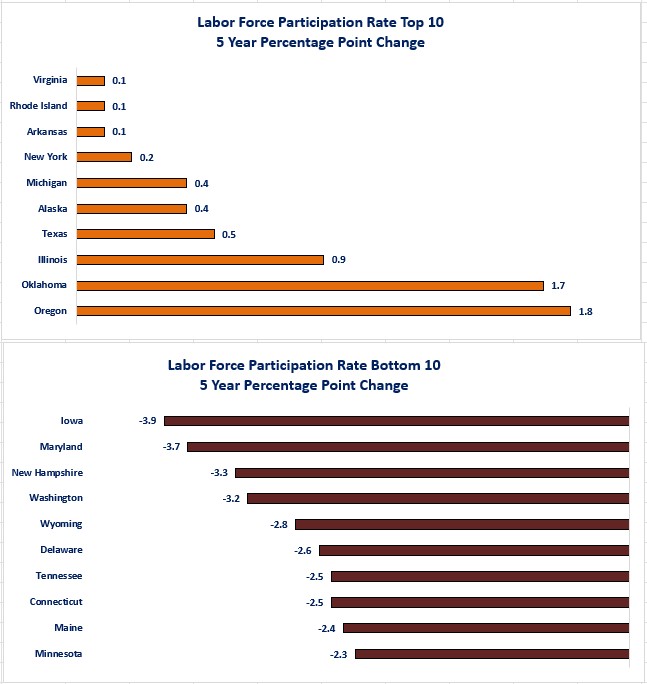
Percentage Point Change From Five Years Ago
-
Only five out of the top ten states for ten-year improvement stayed in the top ten for the five-year period.
-
Illinois, Michigan, Oklahoma, Oregon, New York
-
-
Unfortunately, six out of the bottom ten states were also in the bottom ten for the five-year period.
-
Delaware, Iowa, Maine, Minnesota, New Hampshire and Wyoming
-
Finally, let us examine if the trend continues when examining the one-year time period.
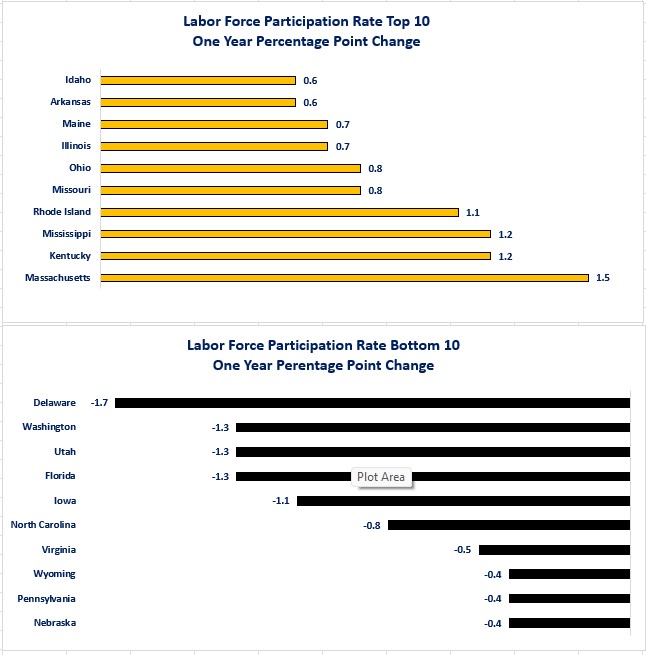
Percentage Point Change From One Year Ago
-
Only Illinois was in the top ten for all three time periods.
-
Delaware, Iowa and Wyoming were in the bottom ten for all three periods.
-
Maine flipped from being in the bottom ten for the ten-year and five-year time periods to being in the top ten for the one-year period. Utah flipped from the top ten for the ten-year period to the bottom ten for the one-year period.
-
Arkansas and Rhode Island were in the top ten for the five-year and one-year time periods while Washington was in the bottom ten for both periods.
Closing thoughts.
- It may seem like a broken record, but the LPFR is another data set that illustrates the bifurcation in our economy.
- There is a 14-percentage point difference between the state with the highest LFPR and the state with the lowest.
-
North Dakota at 68.9% versus West Virginia at 54.9%.
-
-
Currently, 29 states (58%) have a LPFR above the US level of 62.5% while 21 states (42%) are below (see graph of all states below).
- There is a 14-percentage point difference between the state with the highest LFPR and the state with the lowest.
-
The reason states should care about the LFPR, and its trend, is that it will be a factor for economic growth.
-
States with high LFPRs or improving LFPRs may be better positioned to attract businesses because more of their population is participating in the labor force.
-
That implies that these states will be better positioned to supply the labor needed to fill jobs needed to meet any growing demand for goods and services in the state.
-
-
States with low LFPRs or deteriorating LFPRs may face the challenge that more of its population is not participating in the labor pool.
-
This is a problem since that means more of the population is consuming the goods and services of the state but are not providing a labor source to fill jobs needed to meet the demand.
-
-
-
In examining the top and bottom ten states, there is not a clear trend over the ten-year time period except for two states.
-
Iowa has been in the bottom ten for a deteriorating LFPR for each time period.
-
The only potential saving grace for Iowa is that it started with a strong LFPR so, even though it has had one of the worst deteriorations, it is still in the top ten for its current LFPR.
-
-
Delaware is in a worse position.
-
Not only has it been in the bottom ten for deterioration in its LFPR for each time period, it is also in the bottom ten for its current LFPR level.
-
-
-
Three states that rank in the top ten for current LFPR level were in the bottom ten for one year growth.
-
Nebraska, Utah and Virginia.
-
The unresolved question is whether the one-year deterioration is temporary or the start of a longer-term trend.
-
-
For the three states where Washington Trust Bank has offices the picture is mixed. All three sit in the middle of the pack for current LFPR but the path for getting there is very different between the three states.
-
Idaho had a rollercoaster ride from improvement to deterioration to improvement
-
#22 for the current LFPR.
-
#16 for ten-year improvement.
-
#23 for five-year deterioration.
-
#10 for one-year improvement.
-
-
Oregon is the best of the three states for improvement. It still has work to do since the improvement has only brought the current LFPR to the middle of the pack.
-
#25 for the current LFPR.
-
#4 for ten-year improvement.
-
#1 for five-year improvement
-
#12 for one-year improvement.
-
-
Washington has experienced a steady deterioration in its LFPR. That means that the population growth it has experienced is primarily growth of people not looking to work (most likely retirees).
-
#26 for the current LFPR.
-
#25 for ten-year deterioration.
-
#4 for five-year deterioration.
-
#2 for one-year deterioration.
-
The other dynamic at play is the problem for states that are considered “hubs" for the technology industry. Given the boom in the technology industry and the strong appreciation of technology company stock prices, many of the workers who have stock options have been retiring early as their wealth has grown far faster than the population as a whole. All else being equal, early retirees reduce a state's LFPR as the early retirees remain part of the population but are no longer part of the labor force.
-
-
-
Given the demographics of the US (i.e., declining birth to death rate) labor may become more and more of a factor in where a business chooses to locate.
-
This may become even more of an issue if the younger generations choose to defer having children until they can afford to buy a house since that would mean slower growth in the labor force.
-
-
States with low LFPRs may be incented or forced to embrace technology (automation, robotics, etc.) more quickly in order to be more productive and remain competitive for attracting new businesses.
-
Clearly, there are multiple factors that determine where businesses choose to locate and where people decide to live. The Labor Force Participation Rate is simply one of those factors, but it is one worth monitoring if labor supply becomes more of an issue.
For those who love the data, the following graph shows the LFPR for all states with the US highlighted in brown.
Current Labor Force Participation Rate-All States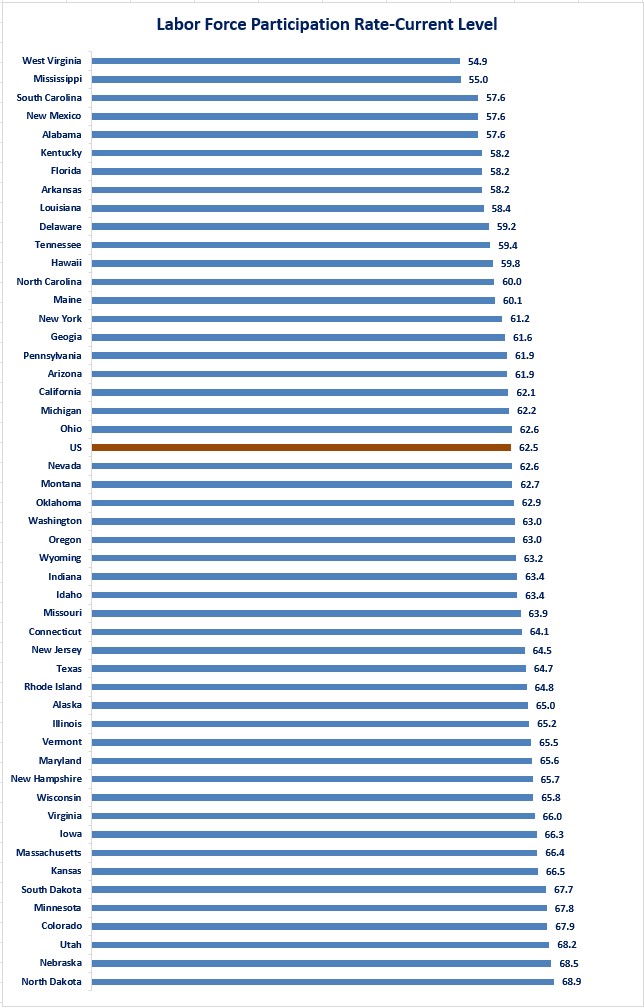
Economic data.

Steve is the Economist for Washington Trust Bank and holds a Chartered Financial Analyst® designation with over 40 years of economic and financial markets experience.
Throughout the Pacific Northwest, Steve is a well-known speaker on the economic conditions and the world financial markets. He also actively participates on committees within the bank to help design strategies and policies related to bank-owned investments.