Perspectives.
As we celebrate the fact that the economy posted solid results for 2024, we always want to consider underlying risks to that growth that may not be captured in the macro data. Last week we gained insight into the divergence in jobless claims when we looked beneath the surface of the positive macro results. This week I will provide information and insight into an economic data set that may provide insight into underlying financial stress for the consumer. That data set is data about multiple jobholders. There may be some people who hold a second job as a side gig for pleasure. An example might be someone who has a second job as a musician in a band because they love music. In reality, most people working multiple jobs do it because of financial needs.
Soundbite.
The number of people working multiple jobs is off its high, but the trend is still rising. This is a trend that should be monitored as a potential indicator that financial stress is rising for a subset of the workforce.
-
More women work multiple jobs than men.
-
The majority of multiple jobholders have a full-time job and a part-time job.
Continued wage increases, declining expenses, or a combination of the two are needed to relieve the need for working multiple jobs.
Disclosures.
-
All data comes from the Bureau of Labor Statistics (BLS) and is as of 12/31/24.
The data will be analyzed for total workers, men and women. It will also analyze the type of multiple jobs being worked.
-
Primary and secondary jobs are both full-time.
-
Primary job is full-time, secondary job is part-time.
-
Primary and full-time jobs are both part-time.
-
Primary or secondary jobs have variable hours.
Since the data is not seasonally adjusted, I am using a three-month moving average as I did last week when examining not seasonally adjusted jobless claims.
-
Observations.
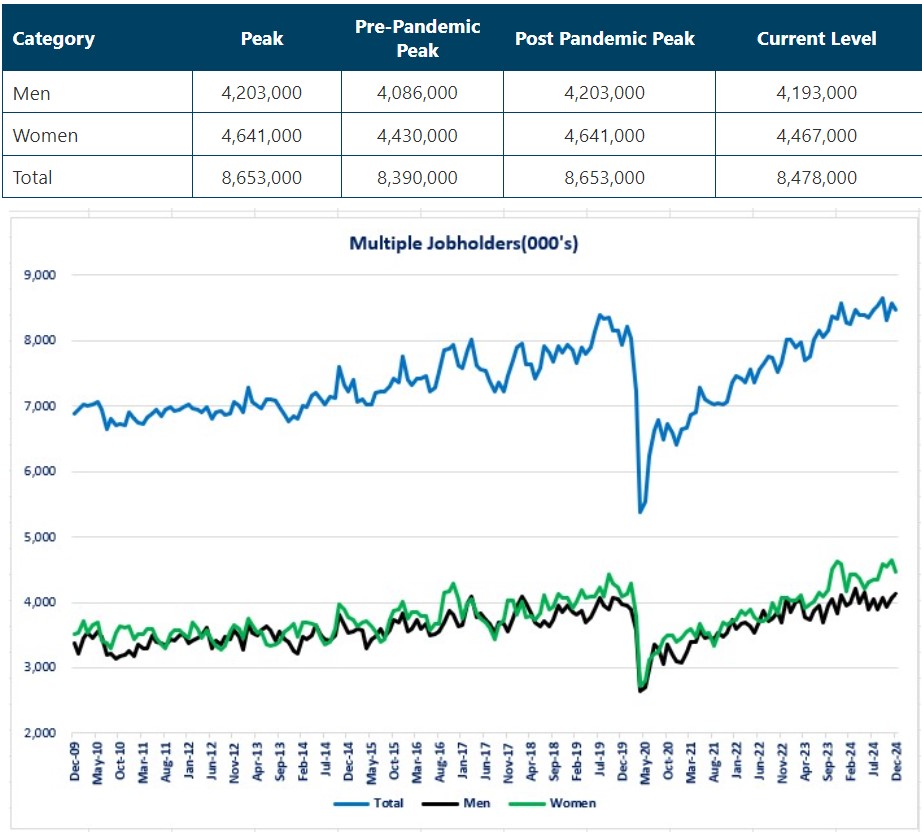
Let us start by examining the total number of people working multiple jobs.
Multiple Jobholders-Total-
For all three categories, current levels are below the peak but above the peak level before the pandemic crisis hit.
-
The trend for women has been growing faster than men since the pandemic crisis.
-
The all-time peak occurred after the pandemic crisis.
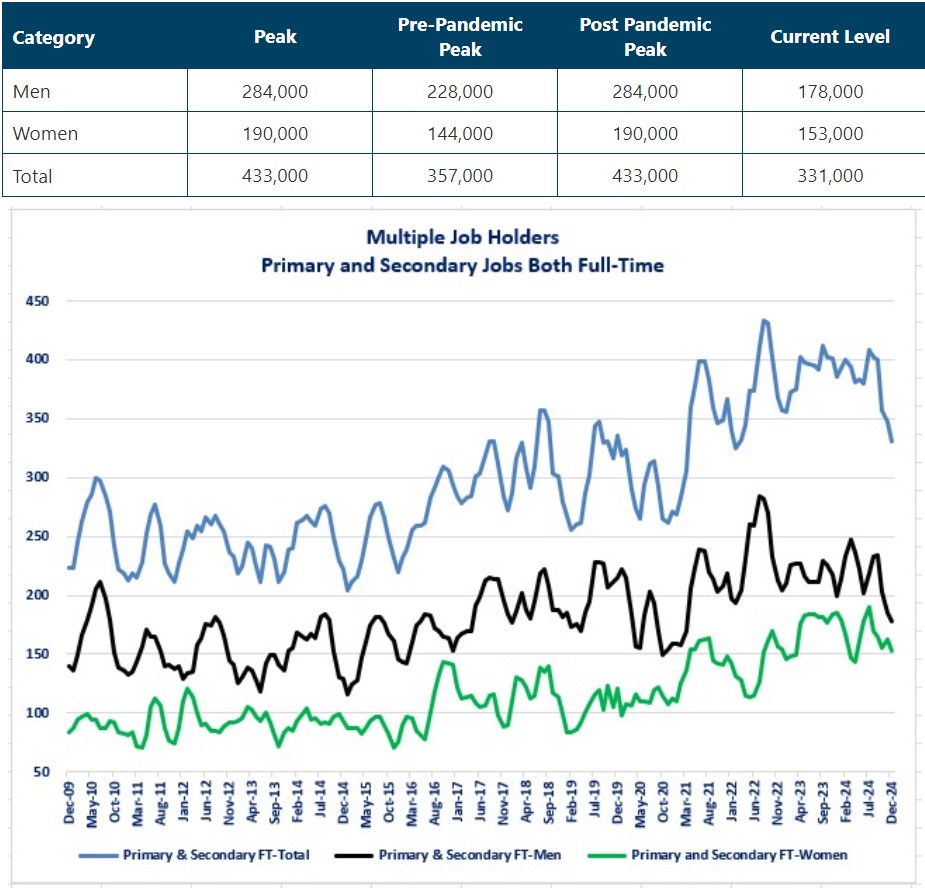
Next, let us examine the category where a worker's primary and secondary jobs are full-time.
Multiple Jobholders-Primary and Secondary Jobs are Full-Time-
Current levels are below the peak level and also below the pre-pandemic peak level.
-
The all-time peak occurred after the pandemic crisis.
-
The recent trend shows a sharp drop.
-
People working two full-time jobs make up 3.9% of total multiple jobholders.
-
Men make up 2.1%.
-
Women make up 1.8%.
-
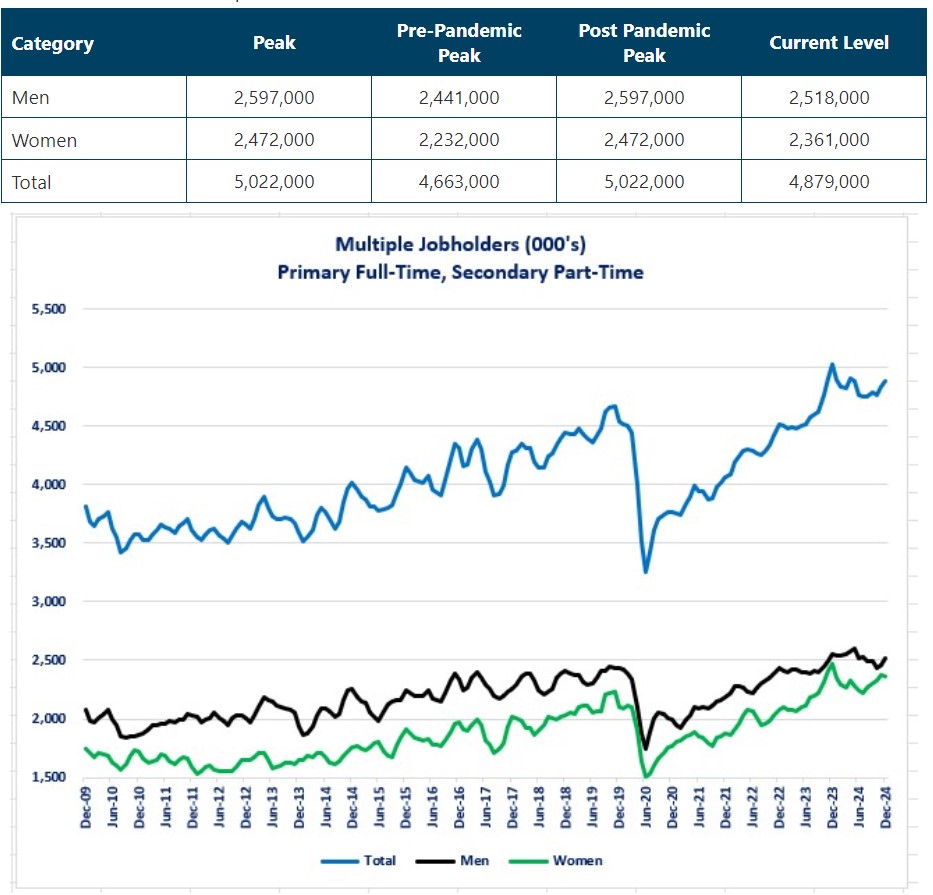
Now, let us look at the most common type of multiple jobholder-primary job is full-time while the secondary job is part-time.
Multiple Job Holders-Primary Job is Full-Time, Secondary Job is Part-Time-
All categories are below the peak but higher than the pre-pandemic peak.
-
Once again, the all-time peak occurred after the pandemic crisis.
-
The trend is rising.
-
This category makes up 57.5% of total multiple jobholders.
-
Men make up 29.7%.
-
Women make up 27.8%.
-
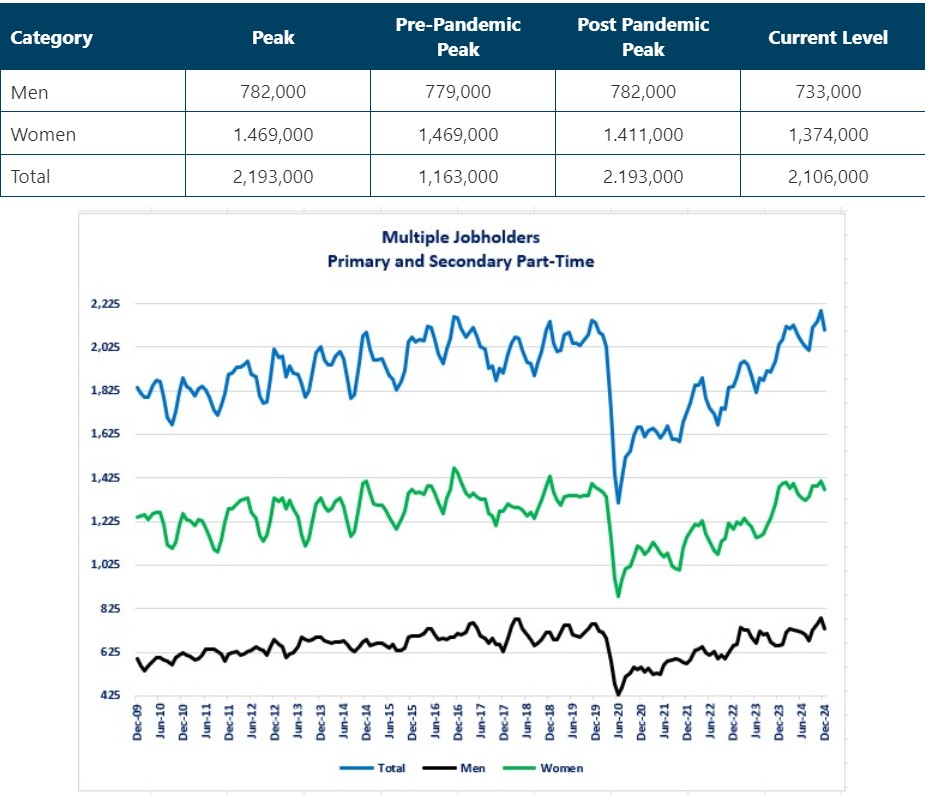
Next, let us examine people who are working part-time for both their primary and secondary job.
Multiple Jobholders-Both Jobs are Part-Time-
All categories are below the peak and below the post-pandemic peak.
-
The all-time peak occurred after the pandemic crisis.
-
The trend is rising, although unevenly.
-
This category 24.8% of total multiple jobholders.
-
Men only make up 8.6% of the total.
-
Women make up almost the double amount almost double the amount as men as they make up 16.2% of total.
-
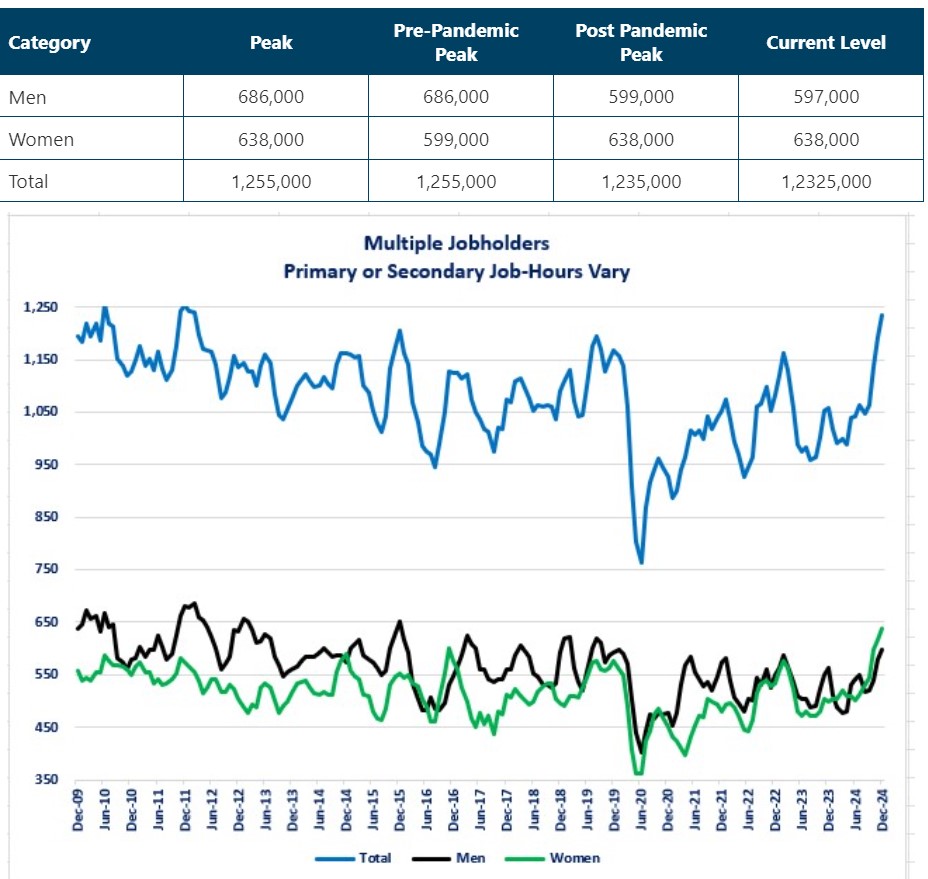
Finally, let us examine people who work multiple jobs, and the hours vary.
Multiple Jobholders-Hours Vary-
The Total category is below the pre-pandemic level (barely) and at the post pandemic peak level.
-
The Men category is below both the pre-pandemic and peak levels.
-
The Women category is above the pre-pandemic peak and at peak levels.
-
-
The trend has recently turned sharply higher.
-
The category makes up 14.6% of the total.
-
Men make up 7.0% of the total.
-
Women make up 7.6% to the total.
-
Closing thoughts.
- The trend for the number of people working multiple jobs is clearly rising.
-
The path is uneven-due to the fact that the data is not seasonally adjusted-but it is still rising.
-
- Overall, more women work multiple jobs than men, but that varies depending on the category of the multiple jobs.
-
Two categories have more men.
-
Both jobs are full-time
-
Primary job is full-time and secondary jobs is part-time
-
-
Two categories have more women.
-
Both jobs are part-time
-
Either job has variable hours.
-
-
-
From my perspective, it is encouraging to see the sharp drop in the number of multiple jobholders who are working two full-time jobs.
-
The physical and mental stress of working that many hours cannot be good for the health and productivity of those workers.
-
Of course, the reality is that there are salaried employees working just one job who may be putting in the same type of hours. The stress risk is the same for them.
-
-
It is intriguing to see the sharp increase in the number of multiple jobholders whose hours are variable.
-
This may be a sign of businesses becoming more proactive in adjusting hours as volumes change.
-
That is not the “dream” job for most workers since you cannot budget for a reliable income stream for paying bills.
-
-
To give some perspective, even though the number of multiple jobholders is on the rise, they do not currently make up a larger percent of total employed workers compared to historical levels.
-
The average from when the BLS started tracking (1994) through 2000 was 6.0%
-
The level as of 3/31/2001 (the start of the tech bubble recession) was 5.5%.
-
-
The average during the 2002-2007 economic expansion was 5.3% of total employed
-
The level was 5.2% as of 12/31/07 (the start of the financial crisis recession).
-
-
The average during the 2010-2019 economic expansion was 4.9%.
-
The level was 5.2% as of 2/28/20 (the start of the pandemic crisis recession).
-
-
The average for the current expansion is 4.9%.
-
The current level is 5.2%.
-
-
-
The risk for the economy is when the consumer reaches the limits of their ability to increase their income to pay their debt.
-
At that point, a group of consumers will be forced to cut back on discretionary spending in order to have enough to pay their core expenses.
-
This is already happening to some of the lowest income households.
-
-
-
Monitoring the trend for multiple jobholders is one more data set that may help us gauge the financial health of the consumer.
-
Based on this data set, the stress level of the consumer is not out of line compared the recent economic cycles.
-
-
If most of the people working multiple jobs are due to financial needs, then continued wage increases, declining expenses, or a combination of the two are needed to relieve the need for working multiple jobs.
Economic data.
|
Economic Data |
Time Period Being Reported |
Current Results |
Previous Results |
Comments |
|
1/14/25 |
|
|
|
|
|
NFIB Small Business Optimism Index |
December |
105.1 |
101.7 |
A surge in optimism that the economy will improve drove the increase. |
|
Producer Price Index (PPI) Year-Over-Year Change |
December |
+3.3% |
+3.0% |
A 3.5% rise in energy prices drove the increase. |
|
Core PPI Year-Over-Year Change |
December |
+3.5% |
+3.5% |
Growth in core prices was the same as November. |
|
1/15/25 |
|
|
|
|
|
Consumer Price Index (CPI) Year-Over-Year Change |
December |
+2.9% |
+2.7% |
Rising energy prices drove the increase for the headline number. |
|
Core CPI Year-Over-Year Change |
December |
+3.2% |
+3.3% |
Core CPI finished the year well above the Federal Reserve's 2.0% target. |
|
MBA Mortgage Applications Weekly Change |
1/10/25 |
+33.3% |
-3.7% |
This was the strongest increase in five years. |
|
1/10/25 |
+26.9% |
-6.6% |
People appear to be fearing that mortgage rates will rise further and are rushing to lock in a purchase now. |
|
1/10/25 |
+43.5% |
+1.5% |
The surge is surprising given the fact that 30-year mortgage rates rose above 7%. |
|
30 Year Mortgage Rate |
1/10/25 |
7.09% |
6.99% |
Mortgage rates continue to rise in step with the rise in long-term Treasury security rates. |
|
New York Federal Reserve Manufacturing Index |
January |
-12.6 |
2.1 |
Manufacturing activity in the New York region fell back into negative growth. |
|
1/16/25 |
|
|
|
|
|
Initial Jobless Claims |
1/11/25 |
217,000 |
203,000 |
Claims rose 14,000 but remain within the range that has existed for the past two years. |
|
Continuing Jobless Claims |
1/4/25 |
1,859,000 |
1,867,000 |
Continuing claims fell 18,000. |
|
Philadelphia Federal Reserve Manufacturing Index |
January |
44.3 |
-10.9 |
Activity surged in December as a surge in capital spending (plants, equipment, etc.) drove the surge. |
|
Retail Sales Year-Over-Year Change |
December |
+3.9% |
+4.1% |
The pace of consumer spending on retail items slowed slightly but remained strong. |
|
NAHB Housing Market Index |
January |
47 |
46 |
Builders' confidence grew in January. |
|
Import Prices Year-Over-Year Change |
December |
+2.2% |
+1.4% |
Prices for imported goods became more expensive. |
|
Export Prices Year-Over-Year Change |
December |
+1.8% |
+0.9% |
The growth rate for export prices doubled compared to November's rate. |
|
1/17/25 |
|
|
|
|
|
Housing Starts Monthly Change |
December |
+15.8% |
+3.7% |
Although the increase looks impressive it was distorted by seasonal adjustment factors that will most likely reverse next month. Starts were up 7.0% not seasonally adjusted. |
|
Building Permits Monthly Change |
December |
-0.7% |
+5.2% |
Permit activity declined slightly in December. |
|
Industrial Production Monthly Change |
December |
+0.9% |
+0.2% |
The increase was led by a solid increase in the manufacturing sector. |
|
December |
+0.6% |
+0.3% |
Manufacturing production showed another month of solid gains. |

Steve is the Economist for Washington Trust Bank and holds a Chartered Financial Analyst® designation with over 40 years of economic and financial markets experience.
Throughout the Pacific Northwest, Steve is a well-known speaker on the economic conditions and the world financial markets. He also actively participates on committees within the bank to help design strategies and policies related to bank-owned investments.


