Perspectives.
As we start a new year, the actions of the Federal Reserve as it relates to interest rates remain an area of focus for consumers, businesses, financial market participants and economists. The Federal Reserve's mandate is two-fold: stable inflation and full employment. Since I have recently analyzed and discussed inflation, this week I will provide information and perspective on unemployment. Specifically, I am going to focus on claims for unemployment benefits (i.e., jobless claims). One of the attractive features of jobless claims data versus unemployment data is that the jobless claims data from the Department of Labor (DOL) are actual claims filed to receive unemployment benefits. The unemployment data from the Bureau of Labor Statistics (BLS) is based on surveys of a sample of households. The difference is that the DOL data is comprehensive in that it captures all of the actual claims being filed, not a sample.
Soundbite.
When examining the data on jobless claims we discover the same story that exists between most national level versus state level economic data: the US economy is not homogeneous. As a result, what you read for national data may or may not match what you and your state are experiencing.
-
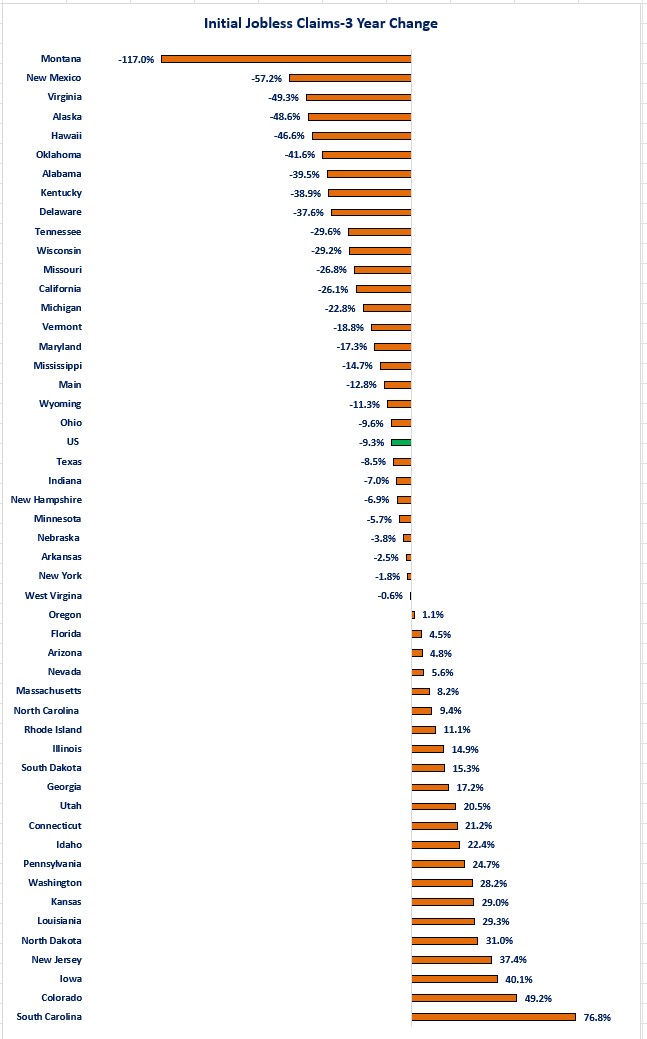
Examining initial jobless claims over the past three years, there is almost an even split between the number of states experiencing a higher level of claims versus those experiencing a lower level of claims.
-
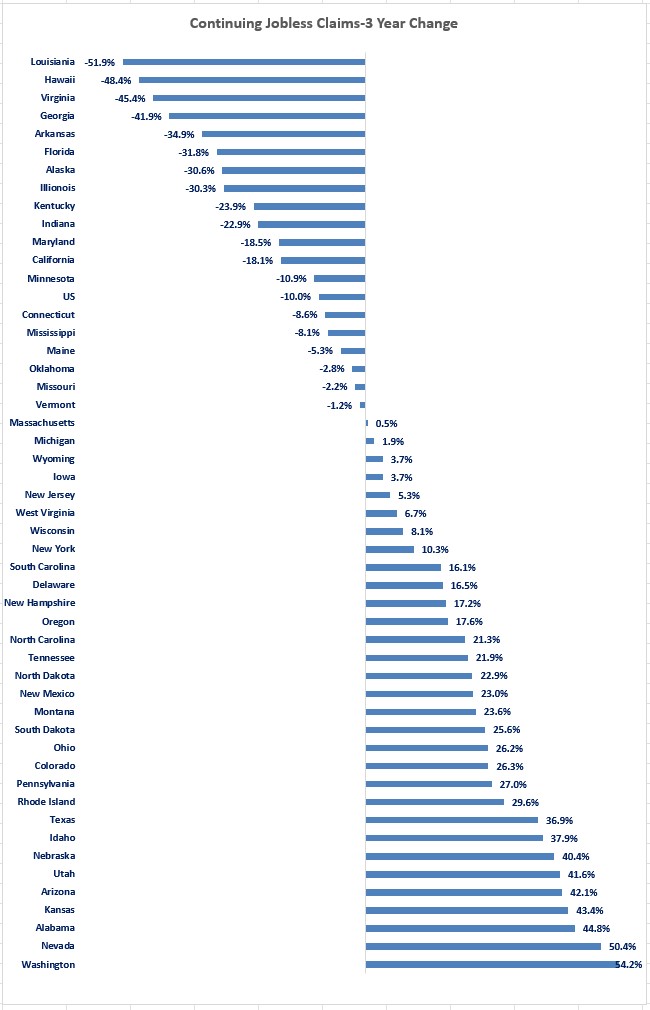
Continuing claims shows a clearer trend of states with higher levels of continuing claims compared to three years ago.
The overall message is that even though there is not a clear trend of more people being laid off (i.e., initial jobless claims), if you have the misfortune of becoming unemployed, there is a clearer trend that it will take longer to find a new job (i.e., continuing jobless claims).
Disclosures.
-
The data is from the Department of Labor.
-
Since the state level data is not seasonally adjusted, I have used the not seasonally adjusted national data as well.
-
Because “raw” data may have seasonal factors on a weekly or monthly basis, I have used a three-month moving average in an effort to smooth out some of the seasonality.
-
I have examined data since the end of 2021 for two reasons.
-
The extended unemployment benefits from the pandemic crisis were finished by then so the distortions from the extra pandemic crisis benefits motivating people to stay unemployed had ended.
-
The Federal Reserve started raising interest rates at the beginning of 2022 so, the data had not yet been impacted by the rate increases.
-
-
Even though we now have data at the national level for the first week of January, the state data lags by a week. As a result, all of the data is as of 12/28/24.
Observations.
- There is almost an even split between states that have experienced an increase in initial claims compared to three years ago and states that have experienced a decrease.
-
56% of the states experienced a decrease (28 states) and 44% experienced an increase (22 states).
-
The national data shows that the US experienced a 9.3% decrease since the end of 2021.
-

Continuing Jobless Claims
-
Once you file your initial claim for unemployment benefits, if you did not find work immediately, you then continue to file for unemployment benefits until you find a job, or your benefits run out.
-
The picture is the opposite for people continuing to file for unemployment benefits.
-
Only 38% of states experienced a decrease in the number of people continuing to file for unemployment benefits (19 states) while 62% experienced an increase (31 states).
-
The national data shows that the US experienced a 10% decline.
-

Closing thoughts.
- For initial jobless claims, there is clearly a wide divergence in the results when examining state level data. This is evident as the range runs from Montana experiencing a 117% decrease from the 2021 levels while South Carolina has experienced a 76.8% increase.
-
For the three states where Washington Trust Bank has offices, two have experienced increases and one has a marginal decrease.
-
Idaho: +22.4%
-
Oregon: -0.6%
-
Washington: +28.2%
-
-
-
The continuing jobless claims data also shows a divergence between the high and low states as Louisiana has experienced a 51.9% decline while Washington has experienced a 54.2% increase.
-
All three states where Washington Trust Bank has office experienced increases in continuing claims.
-
Idaho: +37.9%
-
Oregon: +17.2%
-
Washington: +54.2%
-
-
-
The primary reason that the national data does not necessarily reflect what is going on at the state level is because California, New York and Texas make up almost 32% of the national totals.
-
California: 18.8%
-
New York: 6.5%
-
Texas: 6.4%
-
-
For the majority of the states the message is that even though there is not a clear trend of more people being laid off (i.e., initial claims are lower than three years ago) if you have the misfortune of being laid off, there is a clearer trend that it will take longer to find a new job (i.e., majority of states have higher continuing claims than three year ago).
-
Even though the Federal Reserve has been highly focused on bringing inflation back under control, it does continue to monitor the jobs situation too.
-
Currently the jobless claims data does not provide any clear message to the Federal Reserve that the jobs market is weak.
-
Based on the strong jobs report for December, the combination of solid jobs growth and no clear trend of a deteriorating labor market it is most likely that the Federal Reserve will pause its process of lowering interest rates at its next meeting.
-
That is little comfort for those who have been laid off and are struggling to find a new job.
-
Economic data.
|
Data |
Period Covered |
Previous Results |
Current Results |
Comment |
|
1/6/25 |
|
|
|
|
|
S&P-Global Service PMI |
December |
56.8 |
56.1 |
The service side of the economy continues to grow. |
|
1/7/25 |
|
|
|
|
|
Factory Orders Monthly Change |
November |
-0.4% |
+0.5% |
Transportation orders dragged the index lower. |
|
November |
+0.2% |
+0.2% |
Excluding transportation, factory orders grew at the same pace as October. |
|
Trade Balance |
November |
-$78.2 Billion |
-73.6 Billon |
The trade deficit widened as imports grew more than exports. |
|
November |
$273.4 Billions |
$266.3 Billion |
Exports grew in November. |
|
November |
$351.6 Billion |
$339.9 Billion |
Unfortunately, imports grew more. |
|
ISM Non-Manufacturing PMI |
December |
58.2 |
53.7 |
Similar to the S&P-Global results, the service sector continues to grow. |
|
Job Openings and Labor Turnover (JOLT) |
November |
8,068,000 |
7,939,000 |
Job openings grew in November. |
|
1/8/25 |
|
|
|
|
|
MBA Mortgage Applications |
1/3/25 |
-3.7% |
-12.6% |
High mortgage rates continued to suppress demand for mortgages. |
|
Initial Jobless Claims |
1/4/25 |
201,000 |
211,000 |
Jobless claims declined 10,000 last week. |
|
Continued Jobless Claims |
12/28/25 |
1,867,000 |
1,834,000 |
Companies may not be laying off more people, but once you are laid off, it is taking longer to find a job. |
|
ADP Nonfarm Payrolls |
December |
+122,000 |
+146,000 |
The number of new jobs being created slowed compared to November. |
|
1/9/25 |
|
|
|
|
|
Challenger Announced Job Cuts Year-Over-Year Change |
December |
+11.4% |
+26.8% |
Layoff announcements continue to grow, but at a slower pace than November. |
|
1/10/25 |
|
|
|
|
|
Nonfarm Payrolls Monthly Change |
December |
256,000 |
212,000 |
The jobs creation engine keeps on humming. |
|
Average Weekly Earnings Year-Over-Year Change |
December |
3.6% |
4.0% |
Most of the jobs creation were in the lower paying industries which brought the average down. |
|
Unemployment Rate |
December |
4.1% |
4.2% |
The unemployment rate declined slightly. |
|
University of Michigan Consumer Sentiment-Preliminary Report |
December |
73.2 |
74.0 |
Sentiment slipped slightly in December. |
|
December |
77.9 |
75.1 |
Consumers are more optimistic about their current conditions. |
|
December |
70.2 |
73.3 |
Although consumers are more optimistic about their current situation, they are less optimistic about the future. |

Steve is the Economist for Washington Trust Bank and holds a Chartered Financial Analyst® designation with over 40 years of economic and financial markets experience.
Throughout the Pacific Northwest, Steve is a well-known speaker on the economic conditions and the world financial markets. He also actively participates on committees within the bank to help design strategies and policies related to bank-owned investments.


