


Economic Summary
It was a relatively busy week for economic data releases. Overall, the picture being painted by this week's data is one where confidence and sentiment rebounded for both small business owners and consumers. The inflation picture has yet to show the full impact of tariffs as many businesses kept prices relatively stable as they were still working off the inventory that they stockpiled in the first quarter.
The major economic data this week was the following.
Confidence and Sentiment
The NFIB released the May results for its Small Business Optimism Index and the results showed that confidence rose among small business owners. Even though confidence rose, uncertainty also rose as fiscal policy uncertainty remains a challenge. In a change from previous months, small business owners rated taxes as their biggest challenge with availability of labor slipping to second place. The University of Michigan Consumer Sentiment Index showed that the sentiment of the consumer also improved. The index rose from a 52.2 level in May to 60.5 in June. The data showed improvement in both the Current Conditions sub-index as well as the Future Expectations sub-index.
Inflation
The Bureau of Labor Statistics (BLS) released the May results for the Consumer Price Index (CPI) and the Producer Price Index (PPI). The results were encouraging but came with a caveat. The Consumer Price Index rose 2.4% while the Core Consumer Price index rose 2.8% on a year-over-year basis. The Producer Price Index rose 2.5% while the Core Producer Price Index rose 3.4% The caveat is that many businesses stockpiled inventory the first quarter and have not had to buy new inventory that may have tariffs. So, the full impact of tariffs on prices may not be shown yet.
Jobless Claims
The Department of Labor reported that 248,000 people filed for initial unemployment benefits last week. This was unchanged from the previous week. Initial claims continue to hold within the 200,000 to 250,000 range but the four-week moving average clearly shows a slowly rising trend. Continuing claims rose by 54,000 to 1,956,000 claims. This continues to highlight that even though employers have been slow to lay off people, if you do get laid off it is taking longer to find a new job.
Mortgage Applications
The Mortgage Bankers Association (MBA) reported a 12.5% increase in mortgage applications last week. This was a rebound from the previous week's 3.9% decline. The 30-year mortgage rate was 6.93%, which was essentially unchanged from the previous week's rate of 6.92%. Applications for both new purchases and refinancing rose by double digits.
Perspectives
Since we are amid college graduations, I thought it would be instructive to examine a study conducted by the New York Federal Reserve. The study examined the history of the unemployment and underemployment rate by college major as well as wages. The study broke down the analysis by the following categories.
-
Young Workers. Young workers are defined as workers between the ages of 22 and 27 years old without a bachelor's degree.
-
All Workers. All workers are workers between the ages of 16 and 65 years old with or without a degree.
-
Recent Graduates. Recent graduates are between the ages of 22 amd 27 years old with a bachelor's degree or higher.
-
College Graduates. College graduates are all college graduates between the ages of 22 and 65 with a bachelor's degree or higher.
Summary
Recognizing that this week's Perspectives section is rather long, here are the highlights for those who want the “Cliff Notes” version.
-
The Recent Graduates category is currently experiencing a faster rise in unemployment than the other three categories.
-
A college degree does matter when it comes to the unemployment rate as the Young Workers category continues to have the highest unemployment rate.
-
When examining college majors, a major with a high early career wage does not guarantee a painless process in finding a job as three out of the top fifteen majors for early career wages are in the top ten for unemployment rates.
-
The highest paying early career wage does not guarantee the top paying mid-career wage.
Observations
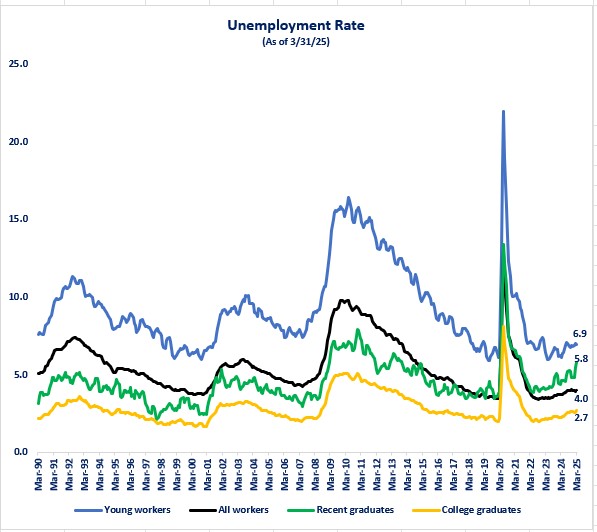
Let us jump into the data to explore what it is revealing. The study started with a broad view by examining the unemployment rate for the four categories defined above. The first graph below highlights the fact that, overall, the College Graduates category consistently has the lowest unemployment rate, and the Young Workers category has the highest. What is interesting is the recent trend that has developed. As you can see from the graph, the Recent Graduates category consistently had a lower unemployment rate than the All Workers category until October 2018. Since then, the Recent Graduates unemployment rate has been higher and has accelerated more in 2025 compared to the other three categories. That implies that it may be hard for this year's graduates to quickly find a job in the field of their major. This is consistent with some of the news stories that have been reporting recent college graduates having a harder time finding a job in their career major.
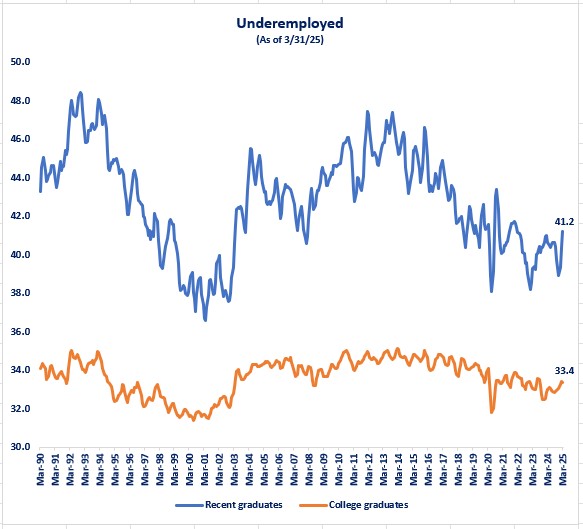
The study then examined the rate of workers who are underemployed. The study's definition of underemployment was the percentage of graduates working in jobs that typically do not require a college degree. A job was classified as a job requiring a college degree if 50% or more of the people working that job indicated that at least a bachelor's degree is necessary; otherwise, the job was classified as a job not requiring a college degree.
The graph below shows that the Recent Graduates category is far more volatile than the College Graduates category. The Recent Graduates category has been steadily trending lower since 2011 while the College Graduates category has been far more stable but also with a downward trend. The trend for both categories is trending higher this year with the Recent Graduates showing a faster rise compared to the College Graduates category. The data indicates that a higher percentage of Recent Graduates are accepting jobs that do not require a college degree. Based on the lower underemployment rate for the College Graduates category, this would indicate that college graduates who initially accepted a job that did not require a college degree, ultimately transitioned into a job that did. The data does not tell us if they moved to a job within their college major or if they took a job that required a college degree but was not in their college major field.
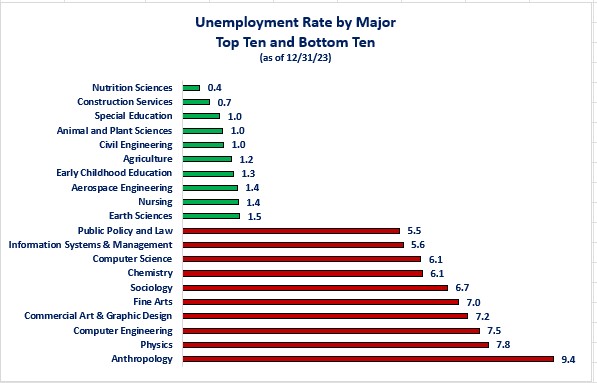
The study then went one step further to examine the unemployment and underemployment rate by college majors. The caveat is that the data for this portion of the study is for a single point in time as of 12/31/23 which is the most recent data available. Whether this holds true now is unknown but, it at least gives some perspective on the diversity of unemployment and underemployment rates by college majors.
Given the focus over the last decade on promoting STEM jobs (Science, Technology, Engineering and Math), it may be surprising (or shocking) to see, of the top ten college majors that had the highest unemployment rate, half were STEM related.
|
STEM Related Majors |
Highest Unemployment Rate |
|
Physics |
7.8% (second highest) |
|
Computer Engineering |
7.5% (third highest) |
|
Chemistry |
6.1% (seventh highest) |
|
Computer Science |
6.1% (seventh highest) |
|
Information Systems & Technology |
5.6% (ninth highest) |
It was not all unwelcome news for STEM related jobs because half of the top ten majors with the lowest unemployment rate were STEM related.
|
STEM Related Majors |
Lowest Unemployment Rate |
|
Earth Sciences |
1.5% (tenth lowest) |
|
Aerospace Engineering |
1.4% (eighth lowest) |
|
Civil Engineering |
1.0% (third lowest) |
|
Animal and Plant Sciences |
1.0% (third lowest) |
|
Nutrition Sciences |
0.4% (lowest) |
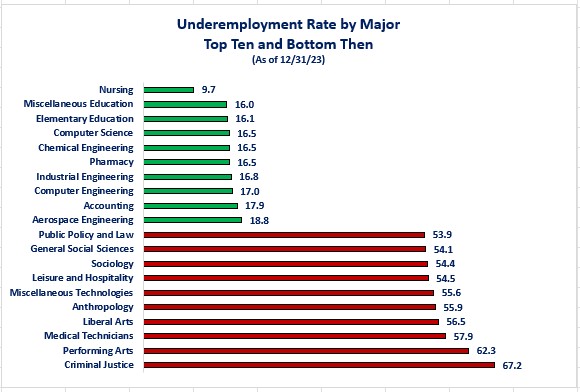
When it came to the underemployment rate, Engineering majors dominated the top ten for the lowest percentage of workers underemployed with 40% of the top ten being engineering majors. Nursing had the lowest underemployment rate at 9.7%.
|
College Major |
Lowest Underemployment Rate |
|
Aerospace Engineering |
18.8% (tenth lowest) |
|
Computer Engineering |
17.0% (eighth lowest) |
|
Industrial Engineering |
16.8% (seventh lowest) |
|
Chemical Engineering |
16.5% (fourth lowest) |
The bottom ten for underemployment was a diversified field of college majors with no category dominating the top ten. Three college majors fell into the bottom ten for both unemployment and underemployment. That indicates that people who graduated with the three degrees listed below may have struggled to find work in their field of major and had to accept a job that did not require a college degree.
|
College Major |
Unemployment Rate |
Underemployment Rate |
|
Anthropology |
9.4% (highest) |
55.9% (fifth highest) |
|
Sociology |
6.7% (sixth highest) |
54.4% (sixth highest) |
|
Public Policy & Law |
5.5% (tenth highest) |
53.9% (tenth highest) |
The study also provided data for wages and broke the analysis into two segments. This data is also as of 12/31/23.
-
Early Career. Early Career measures the median wage for those between the ages of 22 and 27.
-
Mid-Career. Mid-Career measures the median wage of those between the ages of 35 and 45.
The field of Engineering dominated the top fifteen (five tied for the tenth highest) when sorted by Early Career wages. As you can see from the table below by examining the Wage Growth column, just because you may have started with the top salary to begin your career, did not guarantee that you experienced the biggest growth in salary at mid-career.
|
College Major |
Median Early Career Annual Wage |
Median Mid-Career Annual Wage |
Wage Growth |
|
Chemical Engineering |
$80,000 |
$120,000 |
$40,000 |
|
Computer Engineering |
$80,000 |
$122,000 |
$42,000 |
|
Computer Science |
$80,000 |
$115,000 |
$35,000 |
|
Electrical Engineering |
$78,000 |
$120,000 |
$42,000 |
|
Aerospace Engineering |
$76,000 |
$125,000 |
$49,000 |
|
Industrial Engineering |
$76,000 |
$108,000 |
$32,000 |
|
Mechanical Engineering |
$75,000 |
$115,000 |
$40,000 |
|
Civil Engineering |
$71,000 |
$100,000 |
$29,000 |
|
Business Analytics |
$70,000 |
$100,000 |
$30,000 |
|
Construction Services |
$70,000 |
$100,000 |
$30,000 |
|
Economics |
$70,000 |
$110,000 |
$40,000 |
|
Finance |
$70,000 |
$110,000 |
$40,000 |
|
General Engineering |
$70,000 |
$100,000 |
$30,000 |
|
Miscellaneous Engineering |
$70,000 |
$108,000 |
$38,000 |
|
Physics |
$70,000 |
$100,000 |
$30,000 |
The story was even more varied for the bottom ten industries for wages. As you can see from the table below, the growth from early career to mid-career ranged from as much as a $34,000 increase (General Social Sciences) to as little as a $7,000 increase (Early Childhood Education).
|
College Major |
Median Early Career Annual Wage |
Median Mid-Career Annual Wage |
Wage Growth |
|
Anthropology |
$42,000 |
$70,000 |
$28,000 |
|
Early Childhood Education |
$42,000 |
$49,000 |
$7,000 |
|
Family and Consumer Sciences |
$42,000 |
$62,000 |
$20,000 |
|
General Education |
$42,000 |
$55,000 |
$13,000 |
|
Miscellaneous Biological Sciences |
$42,000 |
$75,000 |
$33,000 |
|
Social Services |
$42,000 |
$54.000 |
$12,000 |
|
Theology and Religion |
$42,000 |
$60,000 |
$18.000 |
|
Performing Arts |
$41,900 |
$70,000 |
$28,100 |
|
General Social Sciences |
$41,000 |
$75,000 |
$34,000 |
|
Foreign Languages |
$40,000 |
$70,000 |
$30,000 |
Deciding on what type of college major and career to pursue is always a challenge. I have tried to emphasize to high school students intending to pursue a college degree is that they need to do their research to understand both what it takes to achieve a degree in the various majors and what type of demand there is for the major when pursuing a job. The above information is intended as one tool in the information gathering process.
There is no crystal ball to show you what careers will be most in demand when you graduate or complete technical training. What may have been a hot career when you start your journey may not be the hot career when you have completed your education/training. The suggestions that I give when presenting to high school students who are trying to decide what career to pursue are:
-
Start by identifying what your passion is,
-
Research and understand the skills and education needed to pursue that passion,
-
Decide if you are willing to live the lifestyle needed to pursue your passion.
-
If your desired lifestyle cannot be supported by the wage being paid for the jobs that align with your passion, then you need to resolve which of the two is more important to you.
-
Is it more important to you to work in a career that matches your passion and change your lifestyle to fit the wages associated with the career?
-
Is it more important to you to live your desired lifestyle and accept a career that supports that lifestyle but does not meet your passion?
-
-
-
Think like a business owner to distinguish yourself from your competition as you pursue your career, especially at the beginning of your career journey.
-
A business owner must show prospective customers why they should do business with them. Most successful business owners are always challenging themselves to identify what are the extras that their business offer that sets them apart from their competition.
-
Using that mindset, as you gain your education or training, continuously challenge yourself to answer the following question: Beside your education or training, what are the extra things you are doing to set yourself apart from everyone else to show your prospective employer they should do business with you (i.e., hire you)?
-
Disclosures
The study relied on data from the Bureau of Labor Statistics, Census Bureau, and the Current Population Survey (IPUMS).

Steve is the Economist for Washington Trust Bank and holds a Chartered Financial Analyst® designation with over 40 years of economic and financial markets experience.
Throughout the Pacific Northwest, Steve is a well-known speaker on the economic conditions and the world financial markets. He also actively participates on committees within the bank to help design strategies and policies related to bank-owned investments.